Figures & data
Figure 1 ECLIPSE II study design.
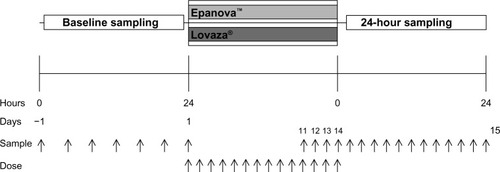
Table 1 Pharmacokinetic parameters calculated for baseline-adjusted total EPA + DHA, total EPA and total DHA following repeated dosing
Table 2 Subject demographics and disposition
Figure 2 Mean unadjusted plasma total EPA + DHA concentrations.
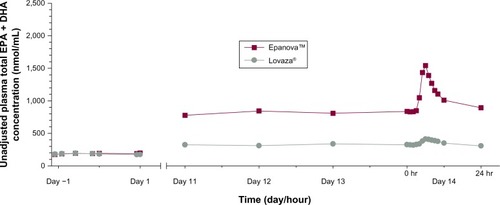
Figure 3 Mean (SD) baseline-adjusted plasma total EPA + DHA concentrations.
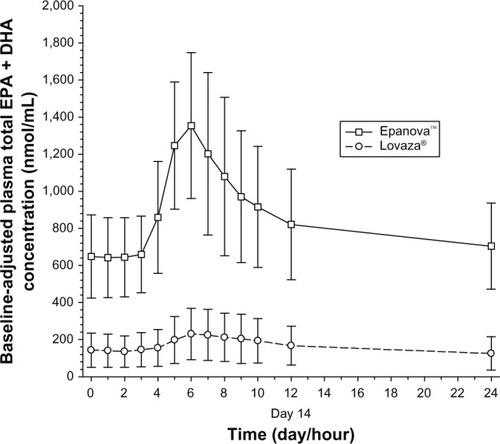
Figure 4 Mean (SD) baseline-adjusted plasma total EPA concentrations.
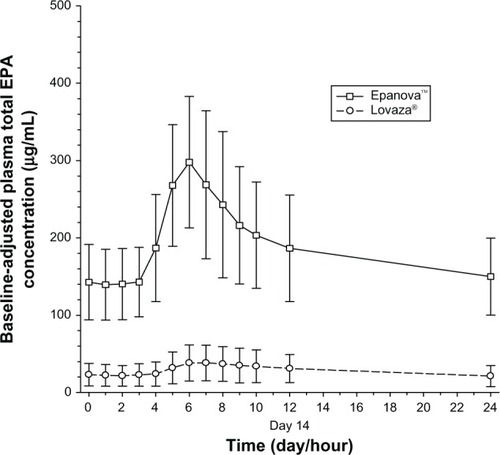
Figure 5 Mean (SD) baseline-adjusted plasma total DHA concentrations.
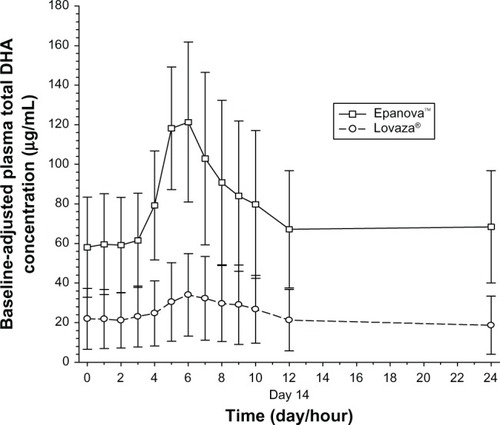
Figure 6 Mean baseline-adjusted plasma total EPA + DHA − Cavg.ss
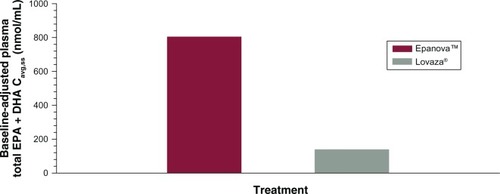
Figure 7 Mean baseline-adjusted plasma total EPA + DHA − Cavg,ss.
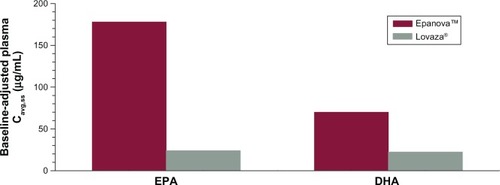
Table 3 Summary of the baseline-adjusted pharmacokinetic parameters of total EPA + DHA, total EPA and total DHA in plasma
Table 4 Summary of the statistical comparisons of the pharmacokinetic parameters of baseline-adjusted total EPA + DHA, total EPA, and total DHA in plasma
Table 5 Summary of the lipid parameters at baseline (mg/dL) and percent change from baseline after 2 weeks of dosing
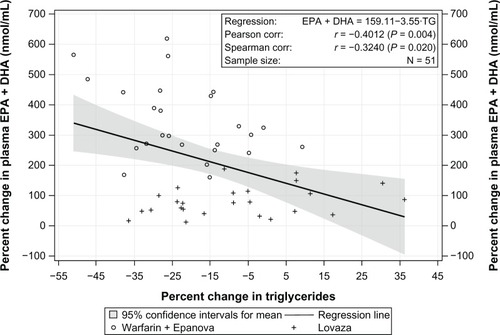
Figure 8 Correlation between percent change in triglyceride levels and percent change in unadjusted plasma total EPA + DHA; Epanova and Lovaza cohorts.