Figures & data
Figure 1 Flow diagram of study population analysis.
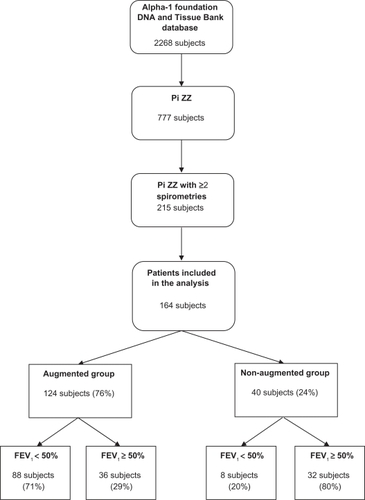
Table 1 Comparative table of the patients receiving versus not receiving augmentation therapy
Table 2 Annual ΔFEV1 for the augmented and the non-augmented groups
Figure 2 ΔFEV1 (mL/year) in augmented and non-augmented patients by initial FEV1 % of predicted (>65%, 30% to 65% and <30%). *P = 0.0006, **P = 0.07.
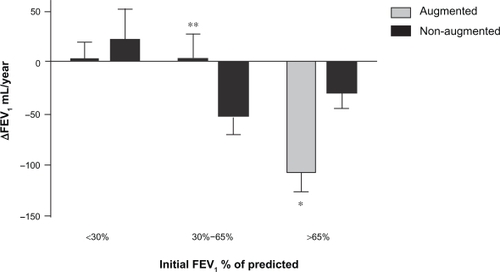
Figure 3 ΔFEV1 (mL/year) in augmented and non-augmented patients by initial FEV1 % of predicted (<50% and ≥50%).*P = 0.026.
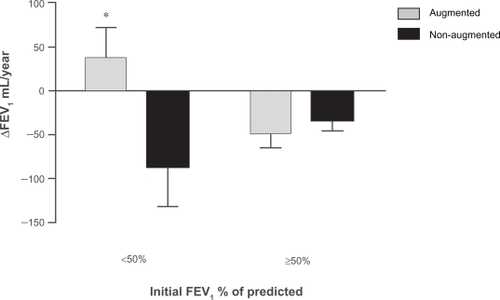
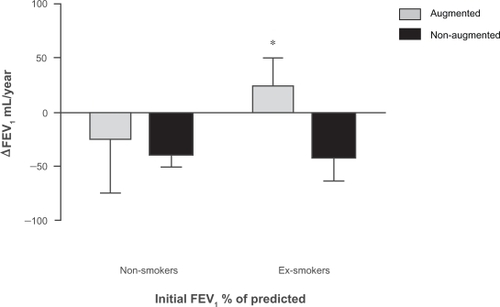
Figure 4 ΔFEV1 (mL/year) in augmented and non-augmented patients by smoking status *P = 0.05.