Figures & data
Figure 1 The Meisenheimer complex. (a) The mechanism of GST-catalyzed reaction of GSH with PABA/NO and with CDNB, showing the formation of the Meisenheimer complex as the reaction intermediate. (b) The diazeniumdiolate ion releases two moles of NO at neutral pH. (c) A relatively stable model for the Meisenheimer complex is provided by the GSTCD− ion. (d) The GSTμ•GSTCD− structure (PDB entry 4GST). (e) The GSTπ•GSTCD− structure (PDB entry 1AQX). In panels d and e, the protein is shown as a molecular surface while the ligand as a stick model in atomic color scheme (carbon in gray, nitrogen in blue, oxygen in red, and sulfur in orange).
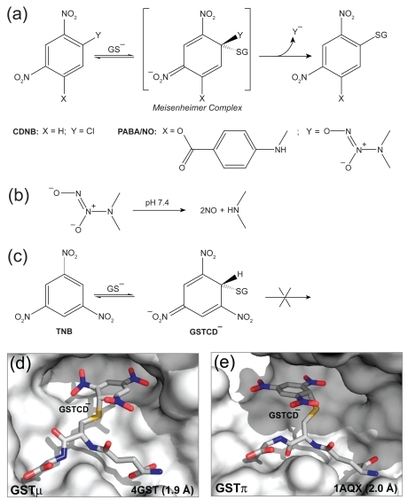
Figure 2 Structure-based design of PABA/NO. Structural modifications of the GSTα-selective compounds 1 and 2 have led to the GSTπ-selective compound 4 (PABA/NO).
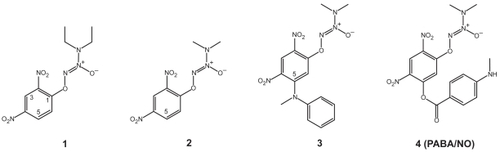
Figure 3 The GSTα•GSTCD− model. (a) Stereoview showing the GSTα•GSTCD− model, constructed on the basis of the crystal structure of GSTα in complex with the GSH conjugate of ethacrynic acid (PDB entry 1GSE), the GSTμ•GSTCD− structure (PDB entry 4GST), and the GSTπ•GSTCD− structure (PDB entry 1AQX). The protein is shown as a molecular surface while the ligand as a stick model in atomic color scheme (carbon in gray, nitrogen in blue, oxygen in red, and sulfur in orange). (b) Stereoview showing the alignment of the GSTCD− ions in the GSTα•GSTCD− model, in the GSTμ•GSTCD− structure (PDB entry 4GST), and in the GSTπ•GSTCD− structure (PDB entry 1AQX). The GSTCD− ion is shown as a stick model in atomic color scheme (nitrogen in blue, oxygen in red, and sulfur in orange; carbon in green when bound in GSTα, cyan in GSTμ, and magenta in GSTπ).
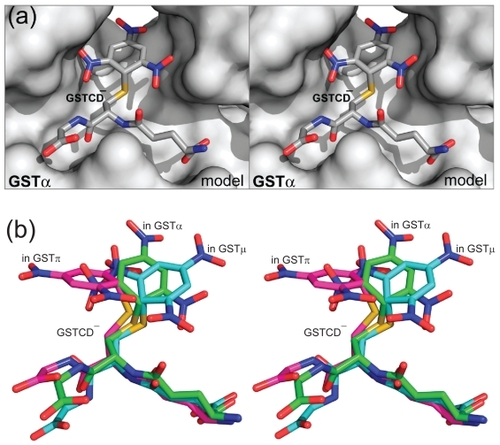
Figure 4 Models of the three GST isozymes with bound Meisenheimer complex of compound 1, 2, and 4. The GST active sites are illustrated as non-transparent surfaces, except for a transparent surface in panels c and g to show the unfavorable interaction between the ligand and the protein (indicated with red arrows), and the ligands as stick models in atomic color scheme (carbon in green, nitrogen in blue, oxygen in red, and sulfur in orange).
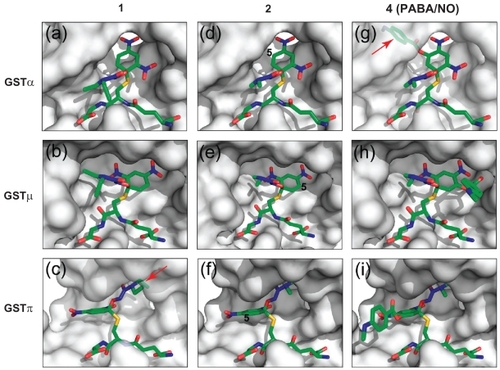
Table 1 Kinetic data for human GST isoenzymes with Compound 1 as the variable substrate
Table 2 Kinetic data for human GST isoenzymes with Compound 2 as the variable substrate