Figures & data
Figure 1 Cholesterol absorption in NPC1L1 (−/−) mice and in (+/+) mice treated with ezetimibe. Drawn from data of CitationAltmann et al(2004); CitationGarcia-Calvo et al(2005).
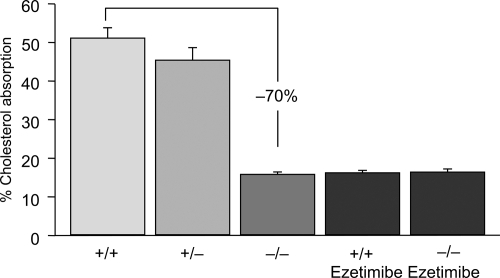
Figure 2 Overview of the principal steps in the intestinal absorption of cholesterol(C). The intraluminal phase involves the digestion/hydrolysis of dietary lipids and micellar solubilization of cholesterol. The membrane transport phase involves cholesterol release from micelles at the brush border membrane and uptake into enterocytes via several sterol transporters, including Niemann-Pick C1like 1 protein(NPC1L1), aminopeptidase N(CD13), and annexin-2/caveolin-1(ANX2/CAV1). The brush border membrane also contains ATP-binding cassette (ABC) transporters(ABCG5 and ABCG8), which primarily move plant sterols and to a lesser extent cholesterol out of the enterocytes.
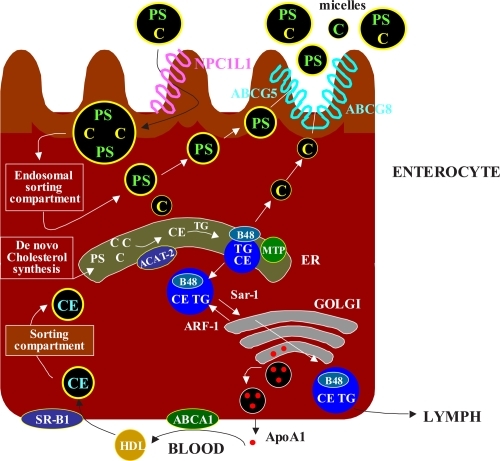
Figure 3 Ezetimibe Add-On to Statin for Effectiveness study: percentage changes in LDL-C overall and by NCEP CHD risk category(n = 3030). Drawn from data of Pearson et al(2005).
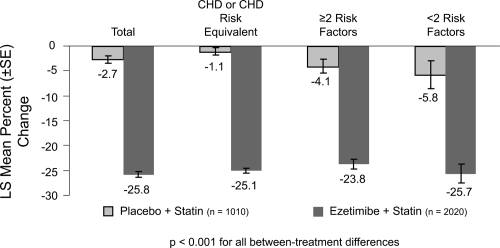
Figure 4 Ezetimibe Add-On to Statin for Effectiveness study: LDL-C goal attainment for patients (n = 3030) not at goal at baseline. Drawn from data of Pearson et al(2005).
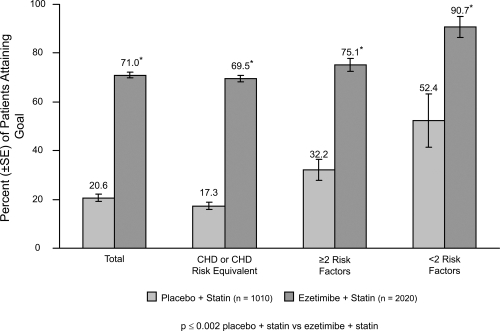
Figure 5 Vytorin Versus Atorvastatin Study: Achievement of LDL-C <100 mg/dL in patients with CHD risk equivalent. Drawn from data of CitationBallantyne et al(2005).
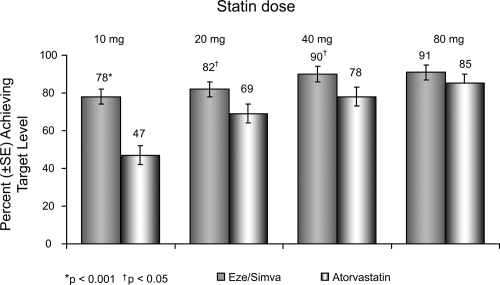
Figure 6 Vytorin Versus Atorvastatin Study: Achievement of LDL-C <70 mg/dL in patients with CHD risk equivalent. Drawn from data of CitationBallantyne et al(2005).
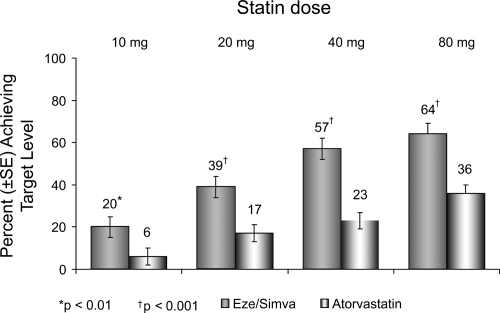
Figure 7 Vytorin Versus Atorvastatin Study: LDL-C reductions. Drawn from data of CitationBallantyne et al(2005).
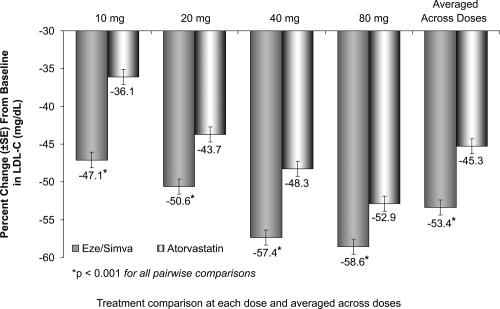
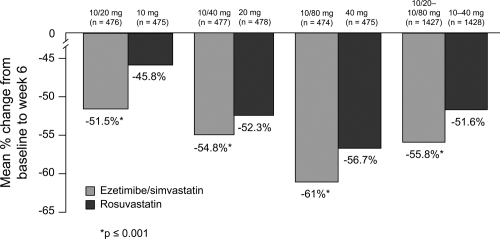
Figure 8 LDL-C reduction across the dose range. Drawn from data of CitationCatapano et al(2006).