2,647
Views
0
CrossRef citations to date
0
Altmetric
Research Article

Surface Tension and Intrinsic Amyloid Fluorescence of Serum and Cerebrospinal Fluid Samples in Alzheimer´S Disease

, , , &
Pages 267-277 | Received 18 Sep 2018, Accepted 13 Dec 2018, Published online: 19 Mar 2019

Figures & data

Table 1. Characteristics of patients providing serum or cerebrospinal fluid samples.

Table 2. Results of surface tension and fluorescence measurements obtained from serum and cerebrospinal fluid samples.

Table 3. Correlation analysis performed on data from surface tension and fluorescence measurements.

Table 4. Ratios of surface tension values to intrinsic amyloid fluorescence signals in serum and thioflavin T-based fluorescence to intrinsic amyloid fluorescence signals in cerebrospinal fluid.

Figure 1. The ratio of thioflavin T-based fluorescence to intrinsic amyloid fluorescence signals in cerebrospinal fluid.

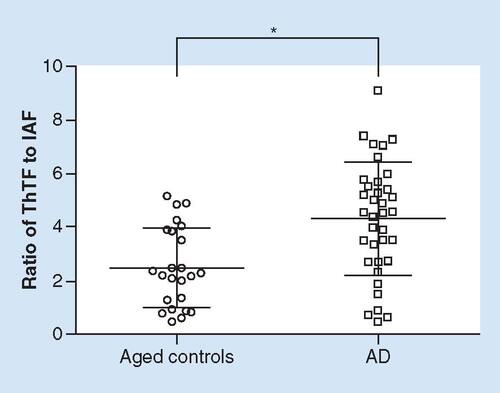
Individual plots showing part of the data presented in . Fluorescence signals were estimated from cerebrospinal fluid samples of aged controls (n = 24) and AD patients (n = 36). Statistical significance (Student´s t-test) was calculated with respect to aged controls.

AD: Alzheimer's disease; IAF: Intrinsic amyloid fluorescence; ThTF: ThioflavinT-based fluorescence.

*p < 0.010.

Figure 1. The ratio of thioflavin T-based fluorescence to intrinsic amyloid fluorescence signals in cerebrospinal fluid.Individual plots showing part of the data presented in Table 4. Fluorescence signals were estimated from cerebrospinal fluid samples of aged controls (n = 24) and AD patients (n = 36). Statistical significance (Student´s t-test) was calculated with respect to aged controls.AD: Alzheimer's disease; IAF: Intrinsic amyloid fluorescence; ThTF: ThioflavinT-based fluorescence.*p < 0.010.

Table 5. Levels of Aβ 1–42, τ and phosphorylated τ in cerebrospinal fluid.