Figures & data
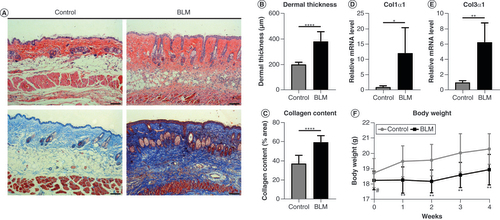
(A) Skin specimens were stained with hematoxylin and eosin (top) and Masson’s trichrome (bottom). Original magnification ×100. Scale bar = 100 μm. (B) Dermal thickness and (C) collagen content were quantified from the hematoxylin and eosin and Masson’s trichrome staining data, respectively (n = 8 per group). (D)Col1α1 and (E)Col3α1 mRNA levels were examined by quantitative PCR (n = 4 per group). (F) Changes in body weight of mice in the control group and BLM-treated group within 4 weeks. Mean ± standard deviation.
*p < 0.05; **p < 0.01; ****p < 0.001 compared with the control group.
#No significance compared with the control group.
BLM: Bleomycin.
(A) PC analysis was conducted to classify the differentially methylated mRNAs of the control group and the BLM group. (B) Amplification of positive control primer set (Pos) and negative control primer set (Neg) by quantitative PCR assay indicated comparable m6A-RNA-immunoprecipitation enrichment % (m6A-RNA-immunoprecipitation/Input) between the control group and the BLM group. (C) The heat map shows opposite m6A-methylated mRNAs between the control group and the BLM group. (D) The volcano plot shows the differently m6A-methylated mRNAs between the control and BLM groups with fold change ≥1.5 and p < 0.05. (E) Chromosomal distribution of m6A-methylated mRNAs. n = 4, each group. Mean ± standard deviation.
#No significance compared with the control group.
BLM: Bleomycin; Chr: Chromosome; m6A: N6-methyladenosine; Neg: Negative; PC: Principal componant; Pos: Positive.
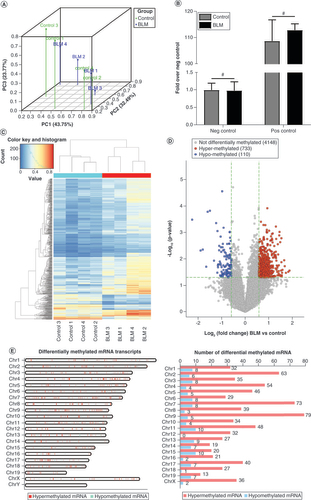
Table 1. Specific gene expression associated with scleroderma.
Table 2. The top 20 differentially expressed mRNAs in the mouse model of scleroderma.
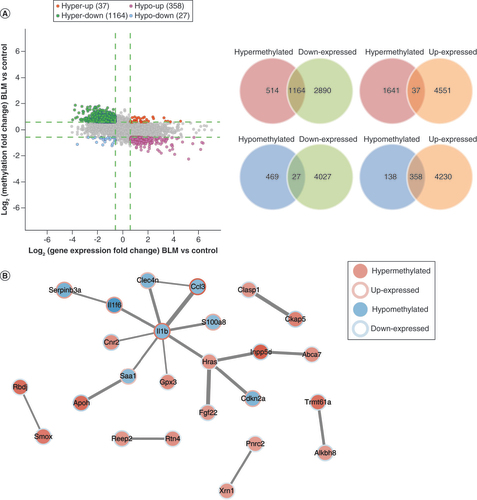
(A) The four-quadrant and Venn diagram showing the N6-methyladenosine-methylated and expressed mRNAs (fold change ≥1.5). (B) The protein–protein interaction network showed the connection between mRNAs in the combined analysis (fold change ≥2).
BLM: Bleomycin.
(A) The top ten Gene Ontology terms of hypermethylated mRNAs, ranked by enrichment score. (B) The top ten Gene Ontology terms of hypomethylated mRNAs, ranked by enrichment score. (C) The top ten significantly enriched pathways of hypermethylated mRNAs, ranked by enrichment score. (D) The top ten significantly enriched pathways of hypomethylated mRNAs, ranked by enrichment score.
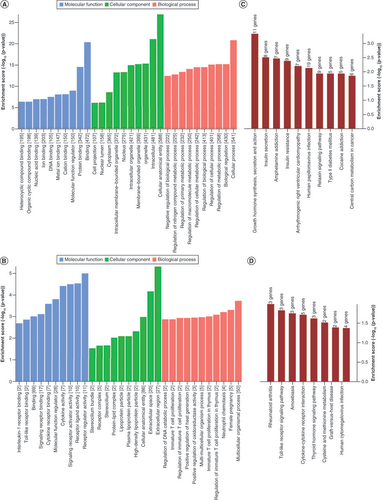
Table 3. Review for the selected genes in scleroderma.
Table 4. Differentially hypermethylated mRNAs involved in the extracellular matrix–receptor interaction pathway.
Table 5. Differentially hypermethylated mRNAs involved in the growth hormone synthesis, secretion and action pathway.
Table 6. Differentially hypomethylated mRNAs involved in cytokine–cytokine receptor interaction pathways.
Table 7. Differentially hypomethylated mRNAs involved in inflammatory response (biological process).
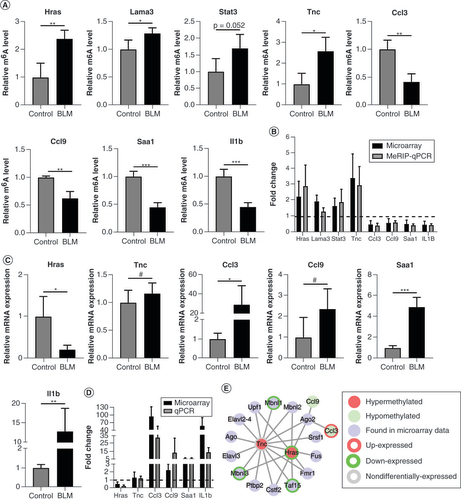
(A) The relative m6A level of the selected mRNAs was detected using MeRIP-qPCR. (B) The comparison between microarray data and MeRIP-qPCR of the selected mRNAs. (C) The six mRNAs were analyzed using qPCR. (D) The comparison between microarray data and qPCR of the selected mRNAs. (E) Identification of RNA binding proteins to the validated m6A-methylated mRNAs differentially. n = 4, each group. Mean ± standard deviation.
#No significance.
*p < 0.05; **p < 0.01; ***p < 0.001 compared with the control group.
BLM: Bleomycin; m6A: N6-methyladenosine; MeRIP: m6A-RNA-immunoprecipitation; qPCR: Quantitative PCR.
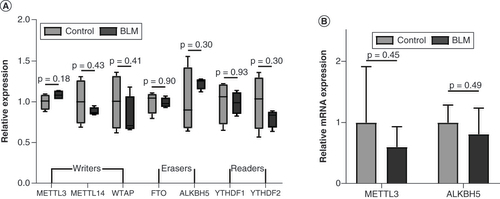
(A) The relative expression of writers, erasers and readers in microarray data. (B)Mettl3 and Alkbh5 were analyzed using quantitative PCR. n = 4, each group. Mean ± standard deviation.
BLM: Bleomycin.