
Figures & data
(A) Volcano plots of the significant differentially expressed genes upon histone binding for macroH2A1.1 (left) and macroH2A1.2 (right). (B) Distribution of peaks in differentially expressed genes relative to the (left) gene structure and (right) distance from the nearest TSS.
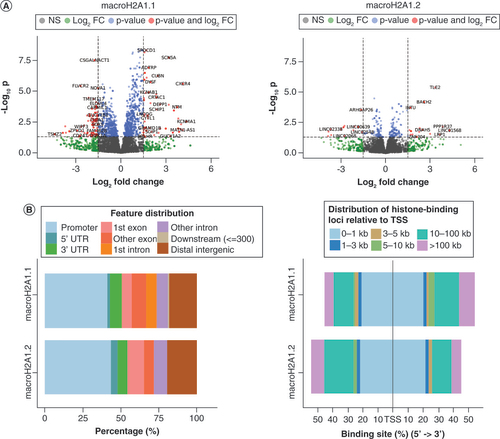
Bars are split into gene regions.
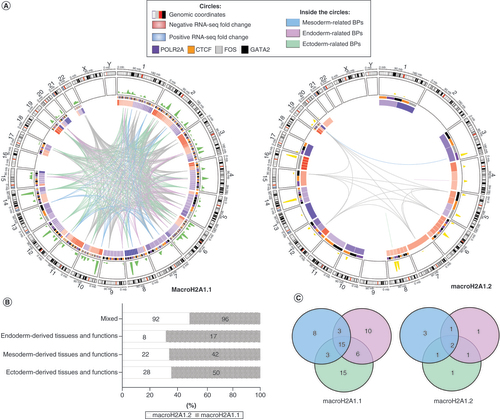
(A) Circos plot representing differentially expressed genes upon histone binding (UHB-DEGs) for macroH2A1.1 and macroH2A1.2, and several features related to their expression, gene ontology (GO) terms and CUT<&Tag peaks. From the outer to the inner tracks of the Circos plots: chromosomes, CUT<&Tag peaks, heatmap of fold-change expression values (red and blue mean upregulated and downregulated genes in macroH2A1.1 or macroH2A1.2 overexpressing cells), UHB-DEGs whose biological processes relate to mesoderm (light blue links), endoderm (light purple) and ectoderm (light green). Gray links were genes associated with more than one germ layer. (B) 100% stacked-bars of the frequencies of GO terms grouped by germ layers. (C) Venn diagram of UHB-DEGs associated with the three germ layers.
Supplemental Information
Download Zip (4 MB)Data sharing statement
The RNA-seq data [Citation22] was deposited into GEO with the dataset identifier GSE164396. Genomics sequences obtained in this study by CUT&Tag has been deposited into GEO with the dataset identifier GSE214013.