Figures & data
Figure 1. Exposome model.
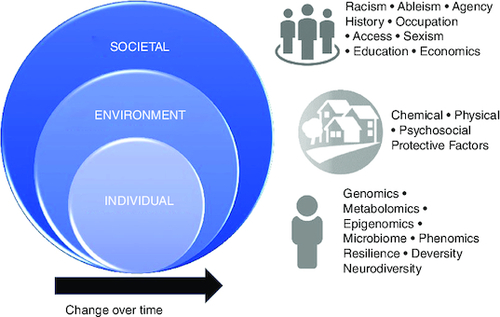
Table 1. Maternal and infant characteristics of participants in the Neonatal Neurobehavior and Outcomes in Very Preterm Infants study.
Figure 2. Heatmap of associations between 24 prenatal exposures (columns) and 10 neurodevelopmental outcomes (rows) after covariate adjustment (nesting of children in families, study site, primary language, infant gestational age at birth, infant sex, neonatal medical morbidities and maternal postnatal psychological distress).
Positive associations are shown in red; negative associations are shown in blue. Standardized coefficients for significant associations are shown.
CBQ: Child Behavior Questionnaire; DCCS: Dimensional Change Card Sort Test; HS: High school; KCPT: Kiddie Continuous Performance Test; NIH: National Institutes of Health; Preg: Pregnancy; SES: Socioeconomic status; SRS: Social Responsiveness Scale; wt: Weight.
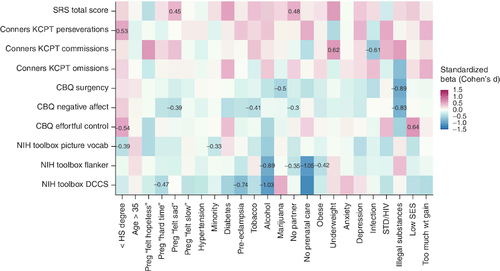
Table 2. Associations between exposures and outcomes in cumulative exposure models.
Figure 3. Variable importance from random forest machine learning models predicting executive function (Dimensional Change Card Sort scores) from (A) exposures only and (B) exposures and DNA methylation.
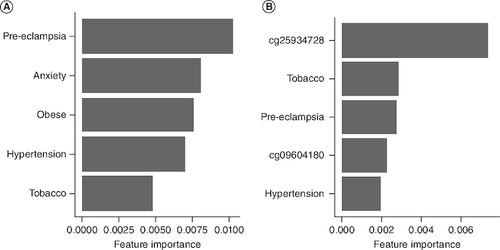
Table 3. Individual exposures and DNA methylation jointly predict child executive function.
Table 4. Cumulative exposures and DNA methylation jointly predict child executive function.
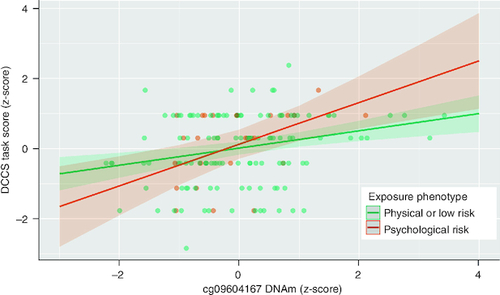
Figure 4. Associations between DNA methylation and child executive function depends on prenatal exposure phenotype.
DCCS: Dimensional Change Card Sort Task.