
Figures & data
Table 1. Baseline characteristics.
Table 2. Patient disposition.
Table 3. Safety.
Table 4. Avelumab serum pharmacokinetics on day 1 (pharmacokinetics population).
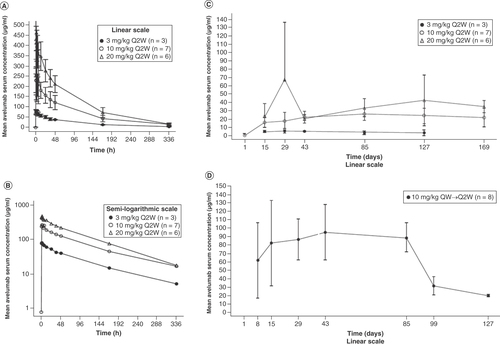
(A) Dose levels (Q2W cohorts), linear (± standard deviation) scale. (B) Dose levels (Q2W cohorts), semi-logarithmic scale. (C) Mean (± standard deviation) trough avelumab serum concentration-time profiles by study day for all dose levels (Q2W cohorts) on the linear scale. (D) Mean (± standard deviation) trough avelumab serum concentration-time profiles by study day for the 10-mg/kg QW→Q2W cohort on the linear scale.
Q2W: Every 2 weeks; QW: Every week.
Supplemental material