Figures & data
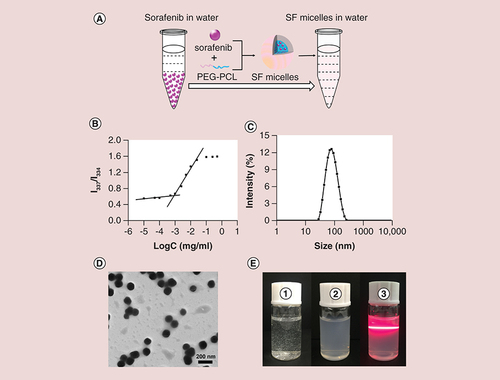
(A) Schematic diagram of the preparation of SF micelles with a core-shell structure. (B) Critical micelle concentration of PEG-PCL micelles determined by fluorescence spectrophotometer using pyrene as a fluorescent probe. (C) Dynamic light scattering analysis and (D) Transmission electron microscopy images of SF micelles. (E) Photographs of (1) sorafenib in water; (2) SF micelles in water; (3) Tyndall effects of SF micelle solution.
PCL: Poly (ε-caprolactone); SF micelle: Sorafenib-loaded PEG-poly (ε-caprolactone) micelle
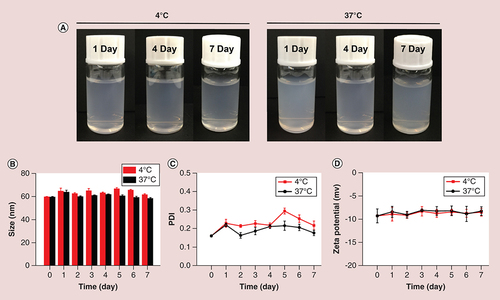
(A) Photographs of SF micelles stored at 4 and 37°C; (B) size; (C) PDI and (D) ζ-potential changes at 4 and 37°C for a week.
PDI: Polydispersity index; SF micelle: Sorafenib-loaded PEG-poly (ε-caprolactone) micelle.
Confocal laser scanning microscopy of HepG2 cells (A) and BEL-7402 cells (B) after incubation with free C-6 or C-6 micelles for 4 h at 37°C. Cell nuclei and cytoskeletal F-actin were counterstained with DAPI (blue) and rhodamine phalloidin (red), respectively. The scale bar was 10 μm. In vitro cell viability of HepG2 and BEL-7402 cells incubated with empty micelles, free sorafenib and SF micelles at different concentrations for 24 h (C & F), 48 h (D & G) and 72 h (E & H) at 37°C.
C-6: Coumarin-6; C-6 micelle: Coumarin-6-loaded PEG-poly (ε-caprolactone) micelle; SF micelle: Sorafenib-loaded PEG-poly (ε-caprolactone) micelle.
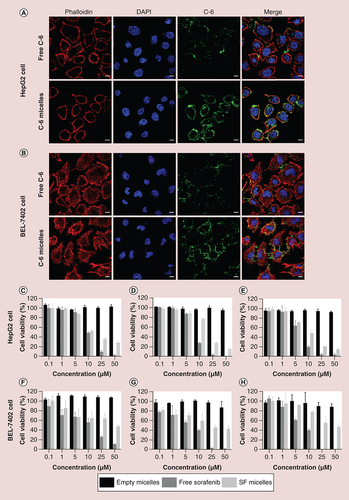
Table 1. The half-maximal inhibitory concentration of free sorafenib and sorafenib-loaded PEG-poly (ε-caprolactone) micelles in HepG2 and BEL-7402 cells after 24, 48 and 72 h incubation.
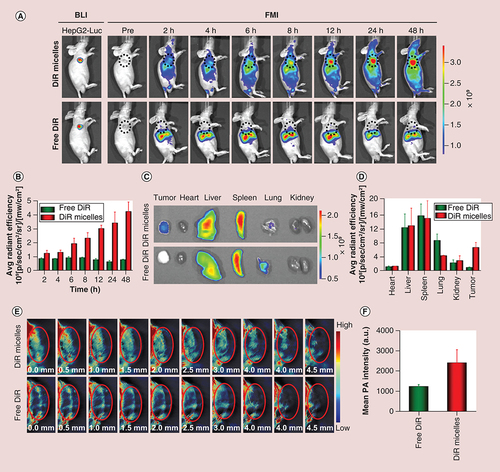
(A) In vivo fluorescence images of the mice at different time points; and (B) quantitative analysis of fluorescence intensity at different points. The tumors were circled with a broken black line; (C)ex vivo fluorescence images of major organs (heart, liver, spleen, lung and kidney) and tumor tissues at 48 h postinjection; (D) quantitative analysis of fluorescence intensity of free DiR and DiR micelles in each organ and tumor. (E) The distribution and (F) quantitative analysis of photoacoustic signals from free DiR and DiR micelles in tumors at a depth of 4.5 mm at 24 h postinjection. The tumors were circled in red.
BLI: Bioluminescence imaging; DiR: 1,1′-Dioctadecyl-3,3,3′,3′-tetramethylindotricarbocyanine iodide; DiR micelles: DiR-loaded PEG-poly (ε-caprolactone) micelles; FMI: Fluorescence molecular imaging; PA: Photoacoustic.
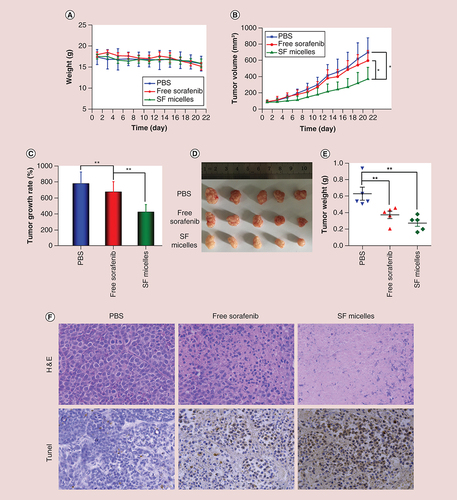
Mice were treated intravenously with PBS, free sorafenib or SF micelles at a sorafenib dose of 5 mg/kg. (A) Body weights and (B) tumor growth curves of mice in the three groups at different time points during the 3-week treatment. (C) Tumor growth rates, (D) tumor images, (E) tumor weights and (F) H&E and TUNEL staining of tumor sections at the end of the treatment. Brown color indicates TUNEL-positive apoptotic cells. Data were given as mean ± standard deviation (n = 5).
*p < 0.05;
**p < 0.01.
H&E: Hematoxylin and eosin; PBS: Phosphate-buffered saline; SF micelle: Sorafenib-loaded PEG-poly (ε-caprolactone) micelle; TUNEL: Terminal deoxynucleotidyl transferase dUTP nick-end labeling.