Figures & data
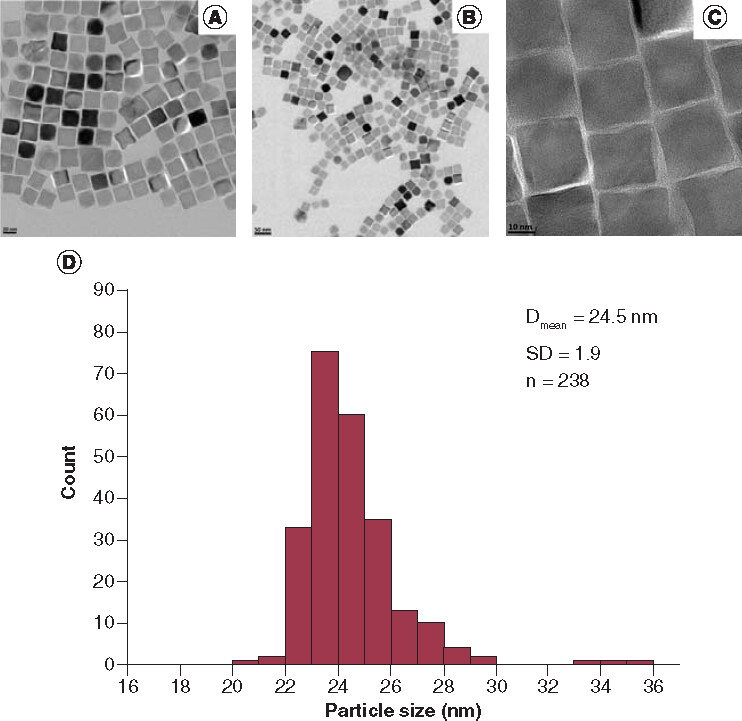
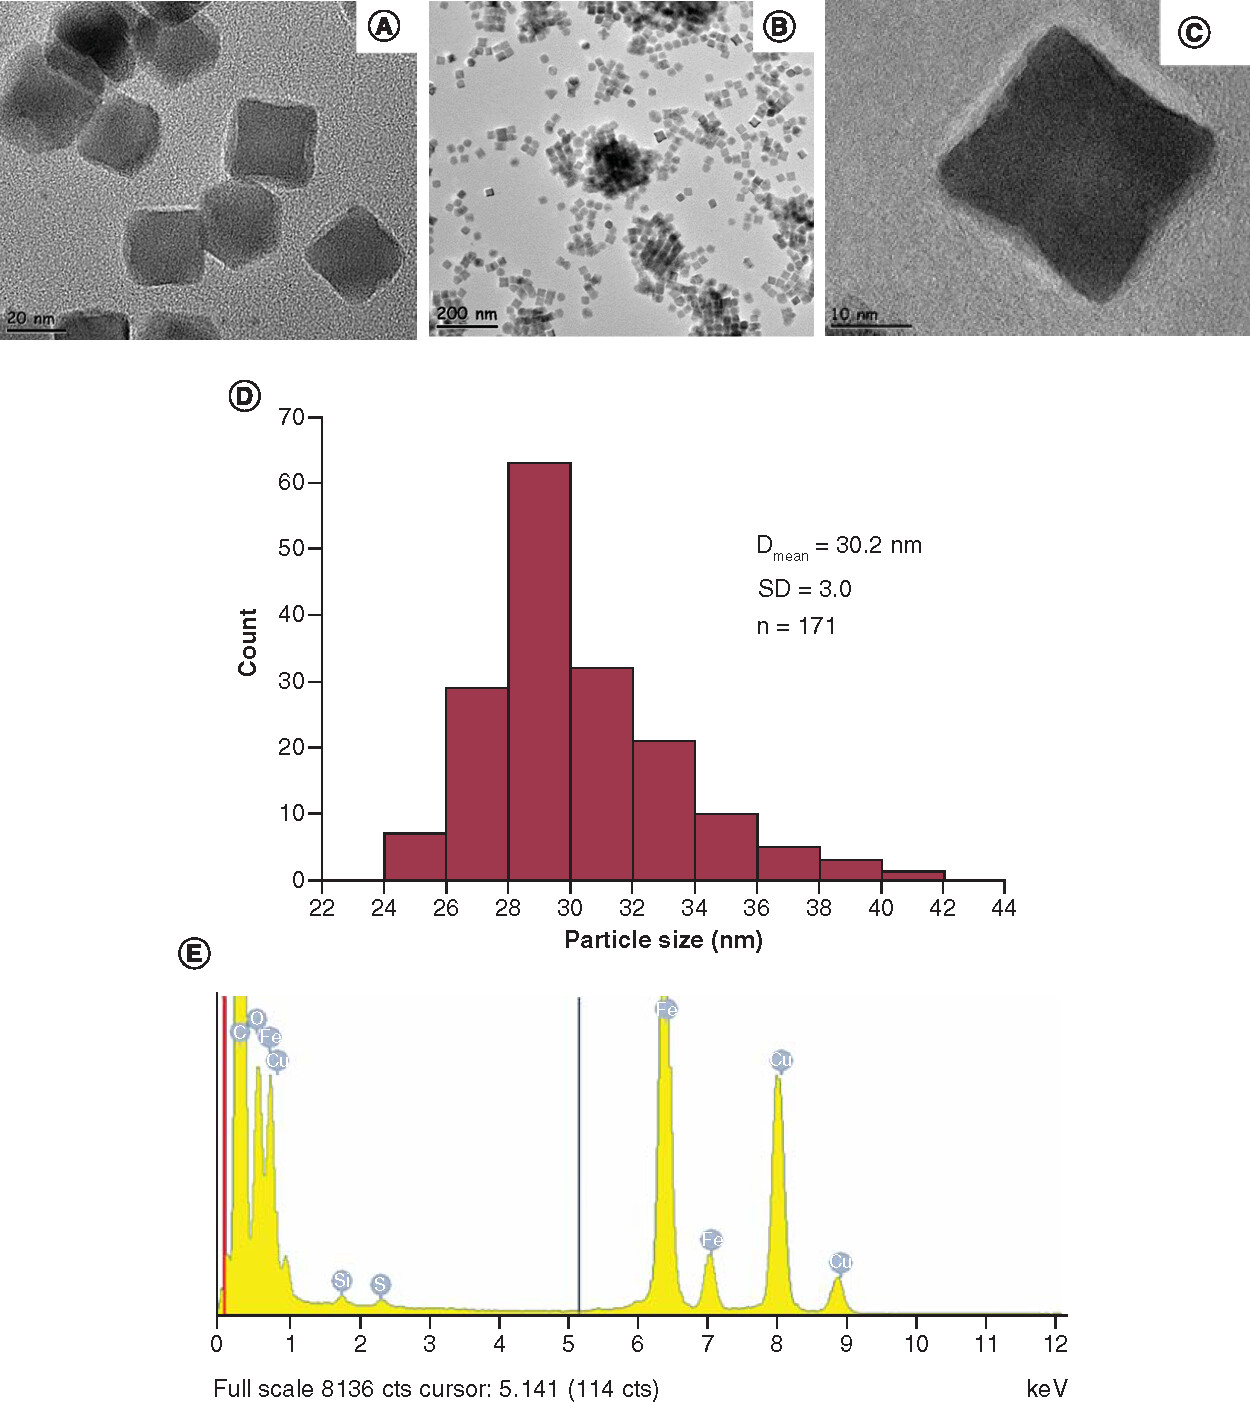
Scale bars for A, B and C: 20 nm, 50 nm and 10 nm, respectively.
Dmean: Mean cube edge length of the nanoparticles; SD: Standard deviation; n: Number of the nanoparticles counted.
Dmean: Mean cube edge length of the nanoparticles; SD: Standard deviation; n: Number of the nanoparticles counted.
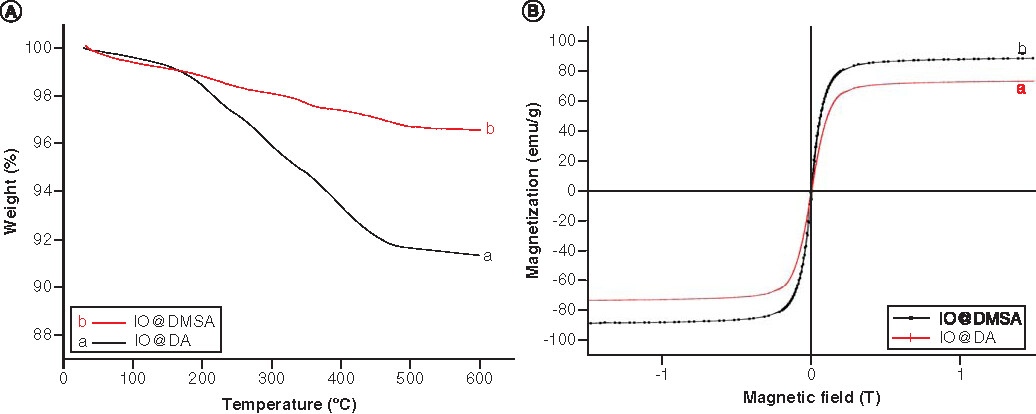
DA: Decanoic acid; DMSA: Meso-2,3-dimercaptosuccinic acid; IO: Iron oxide.
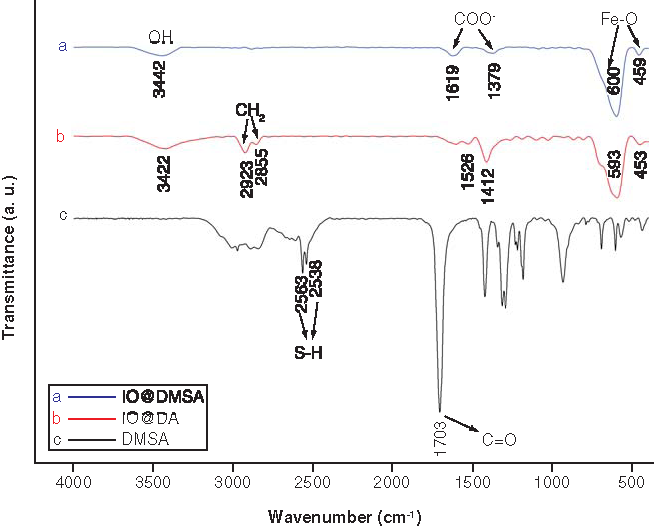
DA: Decanoic acid; DMSA: Meso-2,3-dimercaptosuccinic acid; IO: Iron oxide.
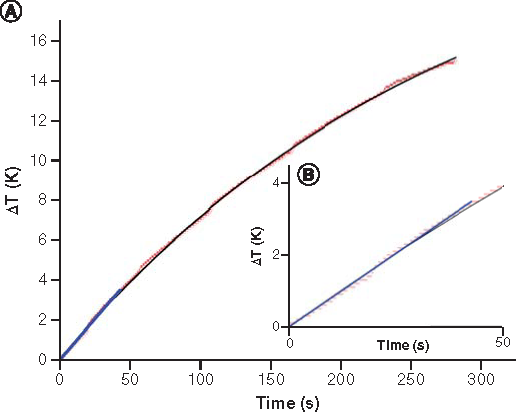
(A) Temperature increase as a function of time (the red line represents the obtained data from the hyperthermia measurement, the black solid line the fit data to function; the blue line is the linear fit showing the initial slope of the black curve at t = 0). (B) Zoom-in view of temperature versus time curve.
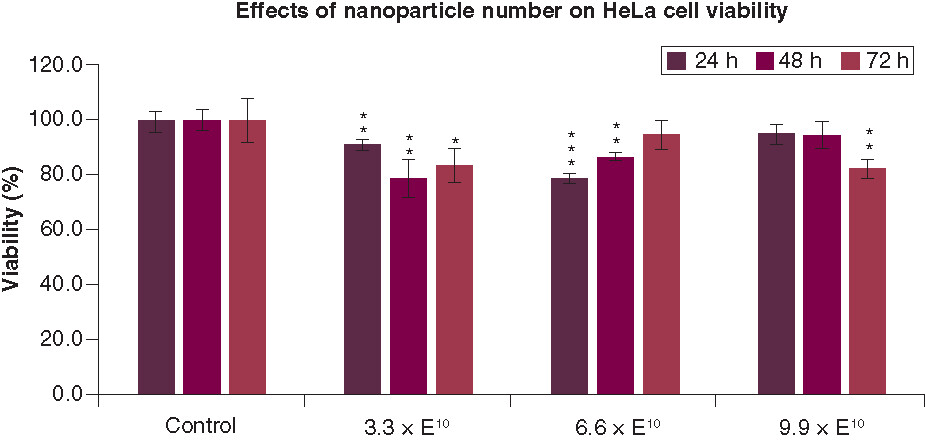
All values are represented as mean ± standard deviation. *p < 0.05; **p < 0.01 and ***p < 0.001.
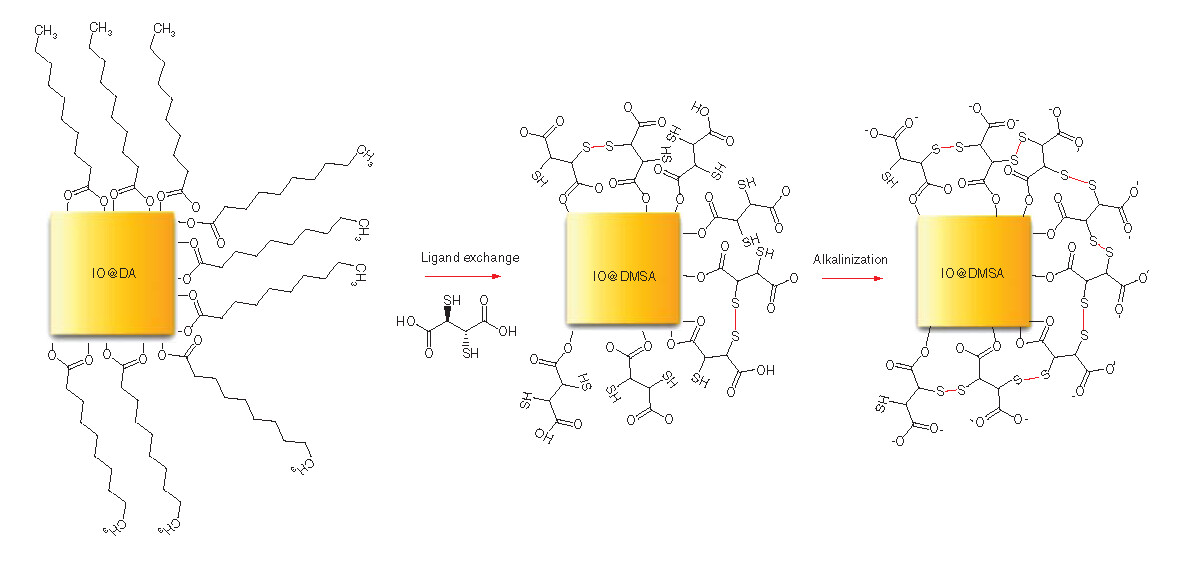
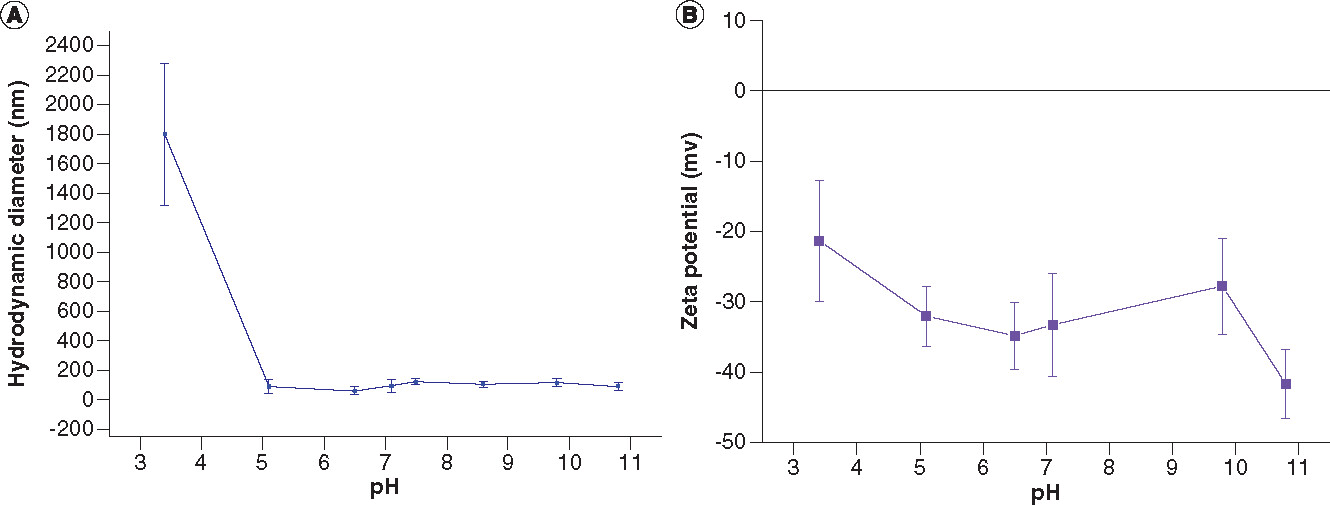
The phase transfer reaction was performed through the reaction of DA-coated IO nanoparticles with DMSA. After ligand exchange reaction, alkalinization (or deprotonization) of DMSA with 1 M KOH solution at pH 10 was performed to enhance the stability of the nanoparticles by electrostatic repulsion between COO- groups and by increasing S–S bonds to reduce hydrodynamic size.
IO: Iron oxide; DA: Decanoic acid; DMSA: Meso-2,3-dimercaptosuccinic acid.