Figures & data
Figure 1. Characterization of polymer-coated gold nanoparticles.
(A) Synthesis of polymers and surface grafting of gold nanoparticles by fluorine polymers. (B) Transmission electron microscopy and histography of polymer-coated gold nanoparticles. (C) UV-VIS of polymer-coated gold nanoparticles from 400 to 800 nm. (D) Interfacial tension of polymer-coated gold nanoparticles at the water–air interface. ****p ≤ 0.0001; one-way analysis of variance, Dunnett's multiple comparisons test.
AuNP: Gold nanoparticle; FNP: Fluoro–gold nanoparticle; IFT: Interfacial tension; RAFT: Reversible addition fragmentation chain transfer.
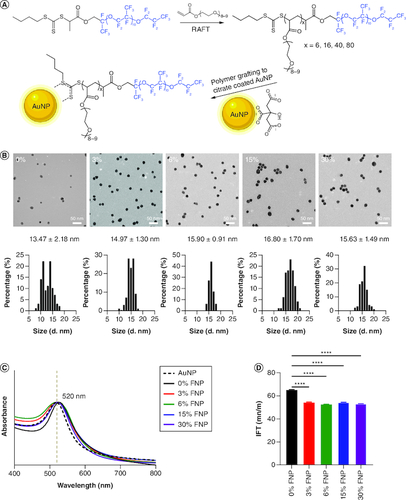
Table 1. Experimental conditions and molecular weights of polymer, determined by gel permeation chromatography.
Figure 2. Chemical synthesis of gold nanoparticles using the Turkevich method.
AuNP: Gold nanoparticle; FNP: Fluoro–gold nanoparticle.
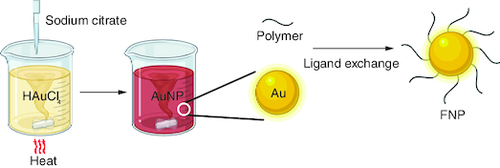
Figure 3. Colloidal stability of fluoro–gold nanoparticles.
(A–C) Hydrodynamic size distribution of polymer-coated gold nanoparticles in H2O, phospahte-buffered saline and DMEM, respectively.
DMEM: Dulbecco's modified eagle medium; FNP: Fluoro–gold nanoparticle; PBS: Phosphate-buffered saline.
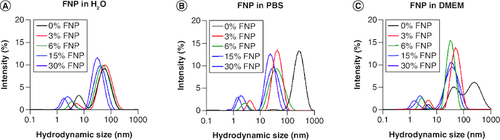
Table 2. Hydrodynamic size of polymer-capped nanoparticles in physiologically relevant solutions.
Figure 4. Cytotoxicity of polymer-coated gold nanoparticles.
Cytotoxicity of polymer-coated gold nanoparticles on (A) CHO-A5, (B) HEK-293 and (C) MDA-MB-231 cell lines after 24 h incubation, n = 3 independent experiments.
FNP: Fluoro–gold nanoparticle.
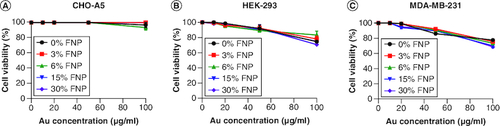
Figure 5. Cellular uptake of polymer-coated gold nanoparticles.
(A) Dark field imaging of RAW 264.7 cells incubated with polymer-coated nanoparticles in OptiMem; red represents the gold content in cells (scale bar: 50 μm). (B) Quantitative analysis of polymer-coated nanoparticle uptake on RAW 264.7 cells using inductively coupled plasma optical emission spectroscopy. ****p ≤ 0.0001; ordinary one-way analysis of variance, Dunnett's multiple comparisons test, n = 3 independent experiments.
FNP: Fluoro–gold nanoparticle.
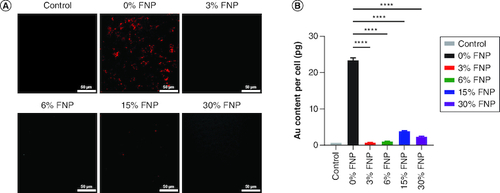
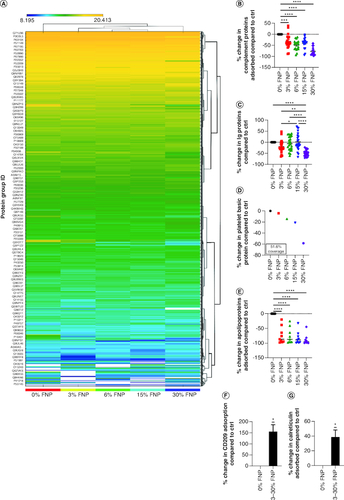
Figure 6. Protein adsorption determined by proteomic analysis.
(A) Heat map for protein absorption. (B) Complement protein absorption compared with 0% fluorine. ***p ≤ 0.001; ****p ≤ 0.0001; ordinary one-way analysis of variance (ANOVA), Dunnett's multiple comparisons test. (C) Ig protein absorption compared with 0% fluorine. *p ≤ 0.05; **p ≤ 0.01; ****p ≤ 0.0001; ordinary one-way ANOVA, Tukey's multiple comparisons test. (D) Platelet basic protein absorption compared with 0% fluorine. (E) Apolipoprotein absorption compared with 0% fluorine. ****p ≤ 0.0001; ordinary one-way ANOVA, Dunnett's multiple comparisons test. (F & G) CD209 and calreticulin absorption compared with 0% fluorine, respectively.*p ≤ 0.05; one sample t-test.
Ctrl: Control; FNP: Fluoro–gold nanoparticle.