Figures & data
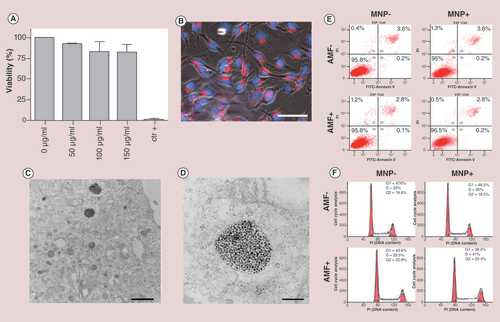
(A) MTT test with increasing concentrations of MNPs (50, 100 and 150 µg Fe/ml) following 24 h of incubation. The measured absorbance from negative control (without MNPs) has been treated as 100% of viable cells. Cell death was assessed treating the cells with Triton X-100 as a positive control. (B) Fluorescence imaging of B16-F10 cells treated with TAMRA-labeled MNPs. The MNPs red fluorescence appears within the cytoplasm, distinct from the nucleus, stained by DAPI (blue; scale bar: 50 μm).(C) TEM images show MNPs compartmentalized into endocytic vesicles (scale bar: 1 μm). (D) High magnification of the endocytic vesicles (scale bar: 200 nm). (E) Flow cytometry plots showing B16-F10 cells distribution following annexin/propidium iodide staining. Left column: MNP-AMF- and MNP-AMF+. Right column: MNP+AMF- and MNP+AMF+. (F) Cell cycle assessment of B16-F10 melanoma cells under four different experimental conditions, as in (E). Not significant differences were shown between the different plots, indicating that the magnetic hyperthermia treatment triggered by MNPs does not affect the cell cycle.
AMF: Alternating magnetic field; MNP: Magnetic nanoparticle.
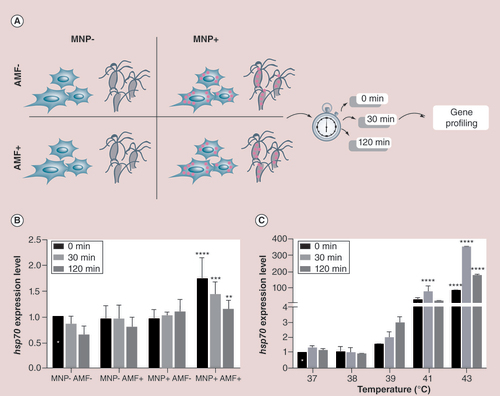
(A) A scheme showing the experimental design performed with B16-F10 cells and with Hydra under four different conditions. Cells/animals were treated 24 h with MNPs, and following 30-min exposure to AMF or external heat, harvested for RNA extraction and real-time quantitative reverse transcription PCR (qRT-PCR) analysis at the indicated time points. MNP+AMF- and MNP-AMF+ were used as controls. (B) qRT-PCR to monitor hsp70 expression levels under the four different conditions and three time points. hsp70 expression levels were compared with cells exposed to the same temperature increment intrinsically induced by AMF exposure (white star labeled column), and normalized to gadph. Black asterices show samples with normalized fold expression statistically different from their corresponding controls unexposed to AMF (**p < 0.01; ***p < 0.001; ****p < 0.0001; two-way ANOVA, Tukey’s multiple comparisons test). (C)hsp70 gene expression of B16-F10 cells heat shocked at different temperatures and analyzed by qRT-PCR immediately (0 min), 30 and 120 min after the treatment. Expression levels were normalized to GADPH and compared with hsp70 expression relative to cells incubated at 37°C at time zero (0 min postincubation; white star). Black asterices indicate samples showing statistically different expression levels relative to their corresponding controls (****p < 0.0001; two-way ANOVA, Tukey’s multiple comparisons test).
AMF: Alternating magnetic field; MNP: Magnetic nanoparticle.
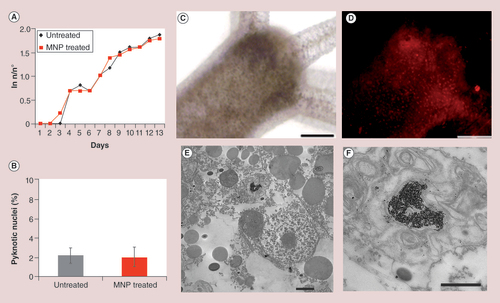
(A) Hydra population growth rate shows that MNP treatment does not affect reproduction capability in the long term. (B) Cellular assessment of apoptosis in MNP-treated animals. Following 24-h incubation with MNPs 2.5 mg Fe/ml, polyps were macerated in single cell suspensions and DAPI stained. No increase in the percentage of fragmented nuclei was observed in treated animals. (C)In vivo brightfield and (D) fluorescence images of Hydra polyp treated with MNPs (24 h, 2.5 mg Fe/ml). A punctuated red staining is clearly visible throughout the animal body indicating efficient internalization of MNPs. (E) TEM analysis shows MNPs compartmentalized into a lysosome. (F) A magnification of the lysosome from (E) shows MNPs as aggregates and monodisperse. Scale bars: 200 μm in (C & D); 2 μm in (E); 1 μm in (F).
MNP: Magnetic nanoparticle.
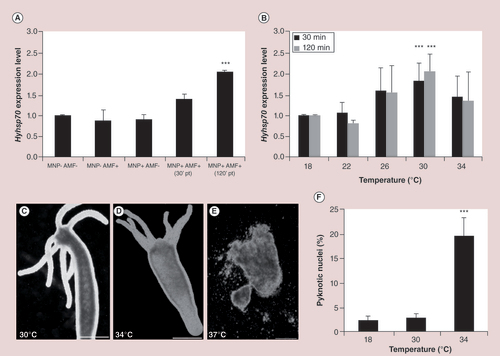
(A) AMF exposure of MNP-treated polyps induces a twofold change of hyhsp70 expression, while MNPs and AMF exposure alone did not modulate hyhsp70 expression. Asterices denote statistically significant expression change relative to untreated animals (one-way ANOVA followed by Tukey’s multiple comparison post-test, p < 0.001). (B) Molecular response to macroscopic heat shock in Hydra. Real-time quantitative reverse transcription PCR analysis revealed that hsp70 is significantly upregulated at 30°C. Asterices indicate statistical significance (p < 0.001; two-way ANOVA with Bonferroni’s multiple comparison post-test). (C, D & E) Heat shock effects on Hydra morphology. (C) Exposure to 30°C does not affect Hydra phenotype, while (D) incubation at 34°C produces slight body contraction and animal paralysis. (E) Short incubation at 37°C provokes devastating effects and tissues appear completely disintegrated. (F) Assessment of apoptosis. Incubation at 34°C for 24 h induces a significant increase of apoptotic nuclei (one-way ANOVA followed by Tukey’s multiple-comparison post-test, p < 0.001). Scale bars: 500 µm in (C & D); 200 µm in (E).
AMF: Alternating magnetic field; MNP: Magnetic nanoparticle.
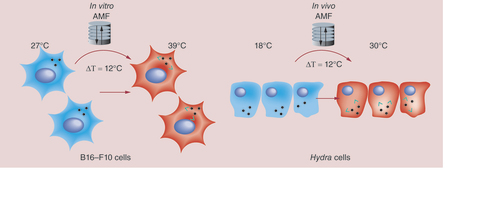
A model is suggested showing similarities between responses evoked in the two diverse systems by magnetic nanoparticles (MNPs). Following AMF exposure, B16-F10 cells show no evident effects of toxicity at macroscopic/cellular level but at molecular level hsp70 overexpression is observed, mirroring that induced by heat shocking the cells at 39°C, thus by shifting of 12°C the initial experimental temperature (27°C). In Hydra, MNP treatment alone does not induce toxicity effects. Exposure to AMF neither affects viability, but induces a doubling of hyhsp70 transcripts. This enhancement mirrors that induced by exposing polyps at 30°C (in a thermal bath), namely by a shift of 12°C above the initial temperature (18°C). Altogether the data show same cell and animal response to MNP-mediated hyperthermia, suggesting their combined use to assess the thermal dose delivered by MNPs in vivo. Green arrows represent local heat production.
AMF: Alternating magnetic field.