Figures & data
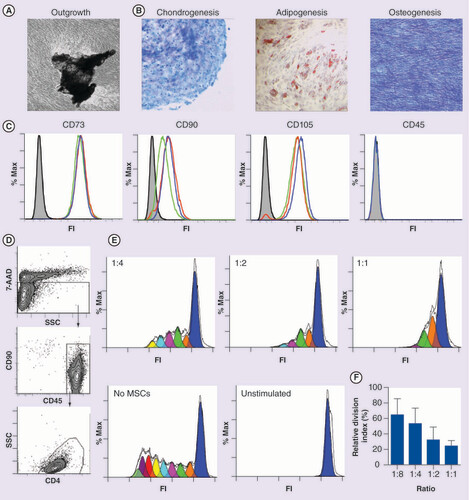
(A) Proliferative and (B) differentiation capacities, chondrogenesis and adipogenesis were assessed on day 21 post-induction by Toluidine Blue or Oil Red-O staining, respectively. Osteogenesis was assessed by alkaline phosphatase staining on day 14 post-induction; original magnification of microphotographs ×100 and ×40 for chondrogenesis. (C) Phenotypic characterization of Osteocel-derived cells confirming their identity as MSCs (n = 3 Osteocel lots). Gray filled histograms indicate isotype control staining. (D–F) Immunosuppressive capacity of Osteocel-MSCs in co-culture with T cell responders (Tresp) CD4+ T cells. (D) Gating strategy for Tresp cell employing initial gating for live cells followed by exclusion of MSCs and final gating on the CD4+ population. (E) Histograms indicating proliferation patterns of Tresp co-cultured at ratios 1:1 to 1:4 with MSCs (a representative donor, colors represent cell doublings). (F) Inhibition of Tresp proliferation measured as relative division index normalized to no MSC control (n = 4 Osteocel lots, 1:1 to 1:8 ratios). Error bars represent SD.
FI: Fluorescence intensity; MSC: Multipotential stromal cell; SSC: Side scatter.
(A) Hematoxylin and eosin staining of decalcified fragments of Osteocel bone; compared with (B) control iliac crest bone; black filled arrows indicate presence of bone-lining cells, white filled arrows indicate embedded octeocytes. (C) Confocal microscopy indicating the presence of live (green) and dead (red) cells on the surface of Osteocel and (D) following the removal of bone reflected light signal showing more live cells embedded in the bone matrix (osteocytes), similar to (A). (E) Abundant osteocytes stained with Crystal Violet, original magnification ×40 and (F) ×100 indicated by white filled arrows.
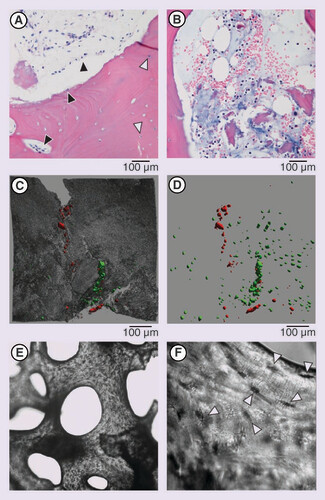
White filled arrows show cell attachment points to bone, fat cells are indicated by dotted outline and black filled arrows.
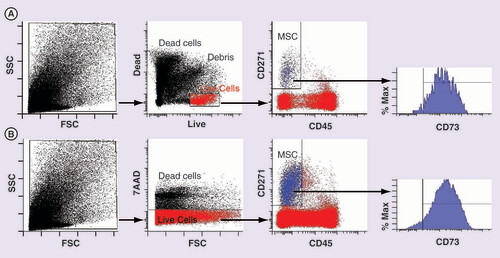
(A) New live/dead binding dyes compared with (B) a traditional 7-AAD-based method. Far left panels: dot plots showing size distribution of all events (cells and debris). Middle left panels: gating on live cells (shown in red). Middle right panels: identification of CD45-CD271+ MSCs (shown in blue). Far right panels: histogram of CD73 positivity on the CD45-CD271+ MSC population. Vertical lines indicate the boundary for isotype control binding, horizontal lines indicate the region used to calculate the proportions of CD73+ cells.
FSC: Forward scatter; MSC: Multipotential stromal cell; SSC: Side scatter.
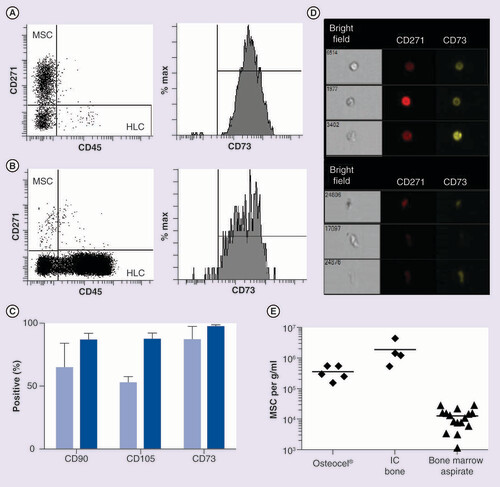
(A) Analysis of CD45-CD271+ MSC abundance in enzymatic digests of Osteocel® and (B) control age-matched IC bone. (A & B) Left panels show the abundance of CD45-CD271+ MSCs and hematopoietic lineage cells, in (A) Osteocel and (B) IC bone, respectively. (A & B) Middle panels show CD73 positivity of CD45-CD271+ MSCs, shown as histograms. Vertical lines indicate the boundary for isotype control binding, horizontal lines indicate a region used to calculate the proportions of CD73+ cells. (C) CD90 (n = 8 lots), CD105 (n = 5 lots) and CD73 (n = 11 lots) expression on CD45-CD271+ cells from Osteocel (light blue bars) compared with IC bone control (dark blue bars; n = 4, four and five donors, respectively). (D) ImageStream™ morphological analysis of CD45-CD271+ in a representative Osteocel digests collected in the ‘live cell‘ gate (top) and debris/demineralized bone matrix gate (bottom). (E) Absolute numbers of CD45-CD271+ MSCs in Osteocel, control IC bone and bone marrow aspirate per 1 g (or 1 ml) indicating inferiority of bone marrow aspirate compared with both IC bone and Osteocel (both significant at p < 0.0001). Error bars represent standard deviation.
HLC: Hemopoietic lineage cell; IC: Iliac crest; MSC: Multipotential stromal cell.