Figures & data
Table 1. Relationship of subject characteristics to self-reported craving in the prayer condition during fMRI scan (n = 18).
Table 2. Regions of interest (ROI) activations for prayer > other. All coordinates are in MNI space.
Figure 1. Brain areas activated for main contrast (prayer > passive + news). The left-anterior middle frontal gyrus (l-MFG; BA 10), left-superior parietal lobule (l-SPL; BA 7), bilateral precuneus (BA 7), and bilateral posterior middle temporal gyrus (MTG, BA 39). Two-tail t-test (df 17) = 2.56, FWE alphasim p < 0.05 corrected, k = 104. The brain is displayed in neurological convention (right = right).
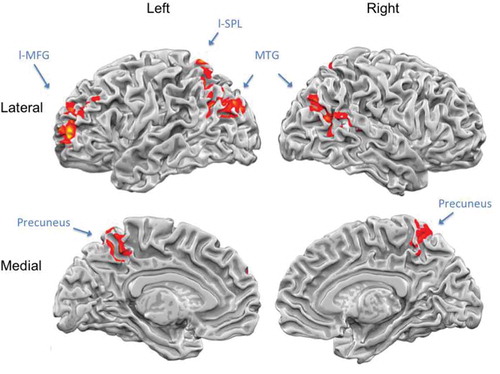
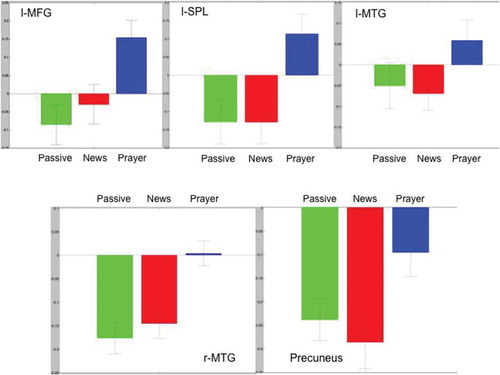
Figure 2. General linear model (GLM) beta plots for the main contrast regions of interest (ROIs). See for details. Green – Passive; Red – News; Blue – Prayer. x-axis: conditions, y-axis: percent BOLD signal change. The left-anterior middle frontal gyrus (l-MFG; BA 10), left-superior parietal lobule (l-SPL; BA 7), left- and right-posterior middle temporal gyrus (l/r-MTG, BA 39), and bilateral precuneus (BA 7).