Figures & data
Figure 1. Water-to-material stopping power ratios for the materials graphite, PMMA, and bone for 270 MeV/u carbon ions. Results obtained with SHIELD-HIT10A are compared to stopping power ratios calculated with the analytical expression in Equation 5. The analytical results are shown as a thin solid line with ×.
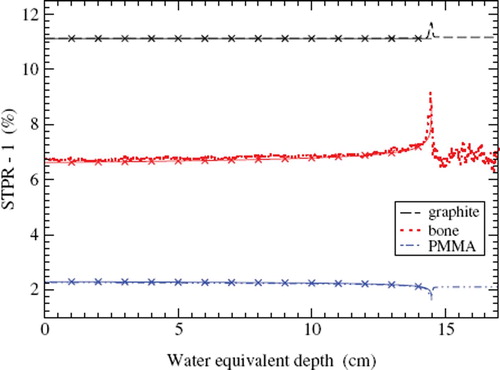
Figure 2. Detail of a carbon ion spread-out Bragg-peak optimized for a flat physical dose distribution in water with TRiP [Citation17]. See the text for explanation. (a) SHIELD-HIT10A simulated depth-dose distributions in water, graphite, PMMA, and bone. The dose in the materials graphite, PMMA, and bone are converted to a dose to water with Equation 3, i.e. without fluence correction factor. The inset shows the peak region enlarged. (b) Stopping power ratios for water to the materials graphite, PMMA, and bone.
![Figure 2. Detail of a carbon ion spread-out Bragg-peak optimized for a flat physical dose distribution in water with TRiP [Citation17]. See the text for explanation. (a) SHIELD-HIT10A simulated depth-dose distributions in water, graphite, PMMA, and bone. The dose in the materials graphite, PMMA, and bone are converted to a dose to water with Equation 3, i.e. without fluence correction factor. The inset shows the peak region enlarged. (b) Stopping power ratios for water to the materials graphite, PMMA, and bone.](/cms/asset/5b992b34-cdb3-4a38-a5bd-15038c3d70d2/ionc_a_581691_f0002_b.jpg)
Figure 3. Like but for a carbon ion spread-out Bragg-peak optimized for a flat biological dose equivalent distribution in water.
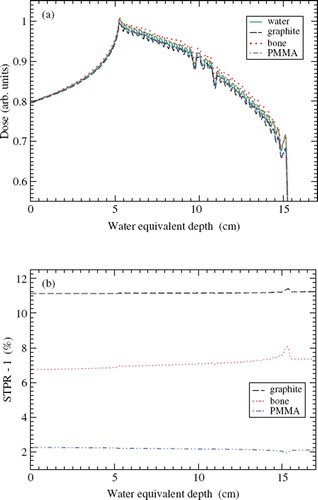
Figure 4. Fluence correction factor for graphite as a function of water equivalent depth obtained with Equation 7 for different primary ions. (a) Protons, (b) carbon ions, (c) nitrogen ions, (d) oxygen ions.
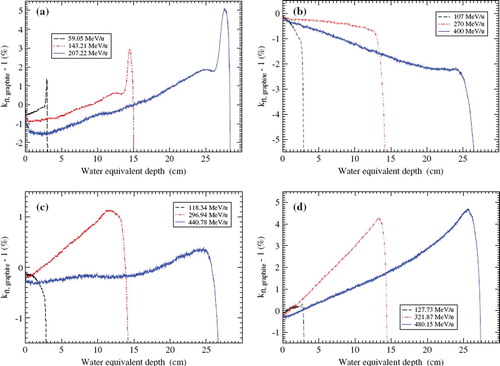
Figure 5. Like but for PMMA. The inset shows the first centimeter on an enlarged scale. (a) Protons, (b) carbon ions.
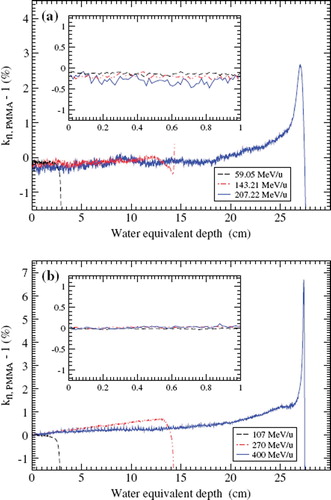
Figure 6. Like but for bone. The inset shows the first 2 cm on an enlarged scale. (a) Protons, (b) carbon ions.
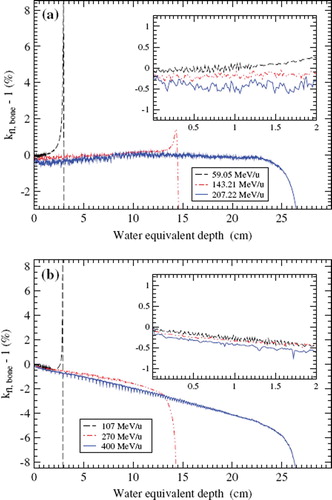
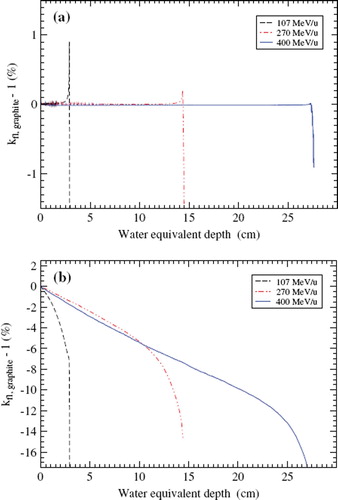
Figure 7. Fluence correction factor for graphite as a function of water equivalent depth for carbon ions obtained with Equation 7. (a) Non-elastic nuclear interactions are not accounted for. (b) It is only accounting for the fluence of the primary ions, i.e. no sum over particle types i. See the text for explanation.