
Figures & data
Figure 1. Stages of dose cold spot experiment performed applying five different types of radiation treatments: non-irradiated control, ‘shielded’ cells received 80% of the prescribed dose, ‘open’ cells received 100% of the prescribed dose separately from shielded cells, ‘slide’ and ‘flask’ cells received 80% and 100% of the prescribed dose in the same flask.
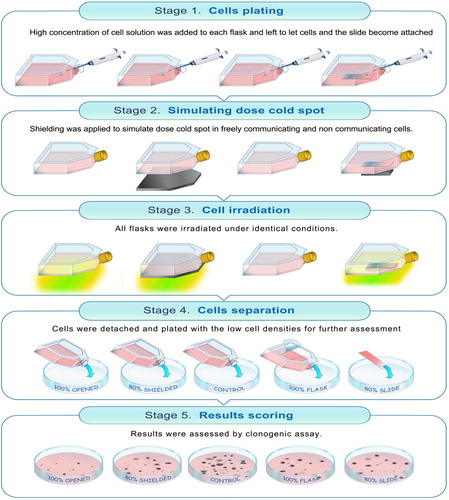
Figure 2. Cell survival curves reported in the literature as compared to current work.
Table I. Mean cell survival fractions and associated standard error values from two independent experiments using triplicate and six-fold samplings.
Figure 3. PC3 cell survival analysis after radiation-induced damage in the underdosed region with and without intercellular cellular communication. ‘Shielded’ and ‘open’ columns represent cell survival after receiving 80% and 100%of the prescribed dose separately. ‘Slide’ and ‘flask’ columns demonstrate survival data in cells which were in direct contact with each other and treated with 80% and 100% of the prescribed dose. In Graph Pad Prism 5 software the level of statistical significance can be chosen between 0.05, 0.01, or 0.001, which graphically presented as *, ** and *** symbols, respectively.
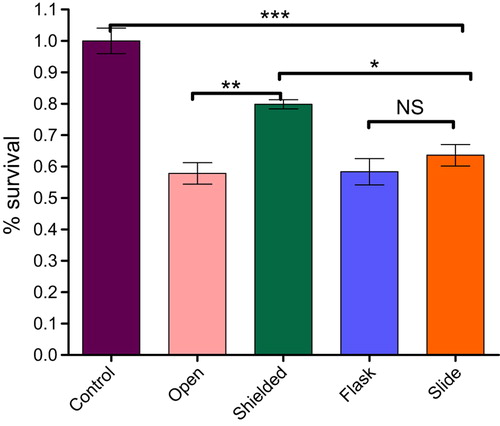
Table II. One-way ANOVA analysis of variances with Post Tukey’s Multiple Comparison Test of the PC3 cell survival in dose cold spot experiment.