
Figures & data
Table I. Characteristics of the study participants treated with preoperative radiotherapy and surgery.
Table II. Stratified analysis of the planned testicular dose.
Figure 1. Spaghetti plot of planned and delivered testicular dose for 32 men treated with short course radiotherapy (25 Gy). CT = computed tomography, CBCT = cone beam computed tomography.
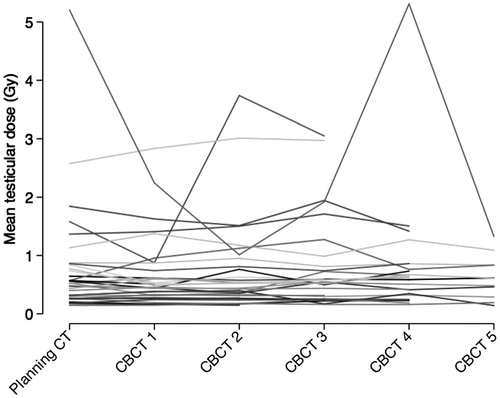
Figure 2. Scatter plot of planned and in average delivered testicular dose for 32 men treated with short course radiotherapy (25 Gy).
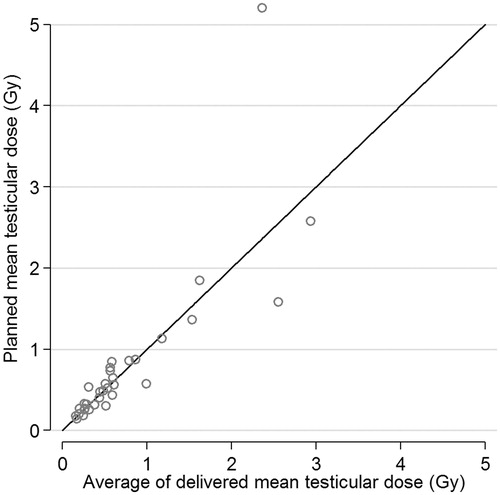
Figure 3. Estimated 25th, 50th, 75th and 90th percentiles of the absolute difference between planned and delivered mean testicular dose for a given planned mean testicular dose. TD = testicular dose.
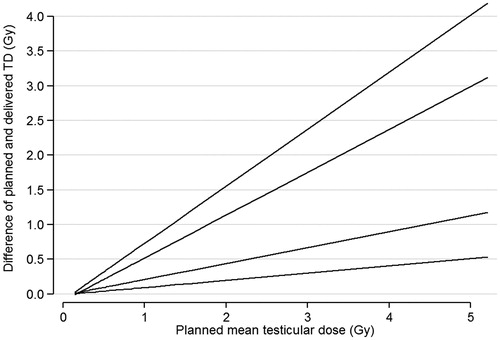
Table III. Longitudinal quantile regression analysis with the inverse of the mean testicular dose based on planning and repeated cone beam CT as outcome.