1,538
Views
29
CrossRef citations to date
0
Altmetric
ORIGINAL ARTICLES: Prostate cancer

Prostate cancer patients’ quality of life assessments across the primary treatment trajectory: ‘True’ change or response shift?

, , , , , , , & show all
Pages 814-820 | Received 25 Aug 2015, Accepted 23 Dec 2015, Published online: 16 Feb 2016

Figures & data

Figure 1. Patient flow. Note. All percentages refer to n = 522 eligible patients.

Figure 1. Patient flow. Note. All percentages refer to n = 522 eligible patients.

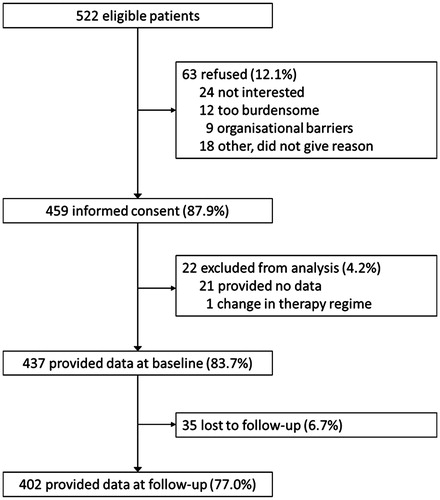
Table 1. Descriptive statistics of the sample.

Table 2. Change of observed EORTC QLQ-C30 functioning subscale scores from baseline to 3-months follow-up.

Figure 2. Structural equation model, with the EORTC QLQ-C30 subscales indicating the latent variable quality of life. Note. Rectangles represent observed variables, circles latent variables, single-headed arrows the impact of one variable on another, and double-headed arrows the covariance between pairs of variables, respectively. The numbers are the parameter estimates of the resulting response shift model: (standardized) factor loadings (λ), (unstandardized) intercepts (τ), residual variances (ɛ) and residual correlations. Parameter estimates separated by a slash represent separate baseline and follow-up assessment estimates; otherwise, unstandardized parameters were constrained to be equal across assessments. Bold numbers indicate response shift. λ indicates factor loadings, τ intercepts, and ɛ residual variances, respectively. CF, Cognitive Functioning subscale; EF, Emotional Functioning subscale; EORTC, European Organization for Research and Treatment of Cancer; PF, Physical Functioning subscale; QoL, quality of life; RF, Role Functioning subscale; SF, Social Functioning subscale.

Figure 2. Structural equation model, with the EORTC QLQ-C30 subscales indicating the latent variable quality of life. Note. Rectangles represent observed variables, circles latent variables, single-headed arrows the impact of one variable on another, and double-headed arrows the covariance between pairs of variables, respectively. The numbers are the parameter estimates of the resulting response shift model: (standardized) factor loadings (λ), (unstandardized) intercepts (τ), residual variances (ɛ) and residual correlations. Parameter estimates separated by a slash represent separate baseline and follow-up assessment estimates; otherwise, unstandardized parameters were constrained to be equal across assessments. Bold numbers indicate response shift. λ indicates factor loadings, τ intercepts, and ɛ residual variances, respectively. CF, Cognitive Functioning subscale; EF, Emotional Functioning subscale; EORTC, European Organization for Research and Treatment of Cancer; PF, Physical Functioning subscale; QoL, quality of life; RF, Role Functioning subscale; SF, Social Functioning subscale.

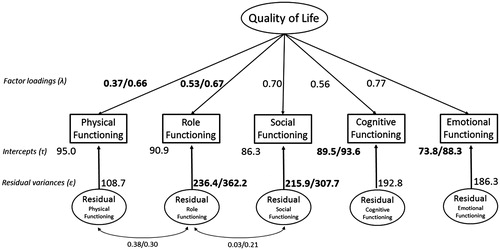
Table 3. Zero-order correlations of the model variables.

Reprints and Corporate Permissions

Please note: Selecting permissions does not provide access to the full text of the article, please see our help page How do I view content?

To request a reprint or corporate permissions for this article, please click on the relevant link below:

Academic Permissions

Please note: Selecting permissions does not provide access to the full text of the article, please see our help page How do I view content?

Obtain permissions instantly via Rightslink by clicking on the button below:

If you are unable to obtain permissions via Rightslink, please complete and submit this Permissions form. For more information, please visit our Permissions help page.