
Figures & data
Figure 1. For the planned dose distributions based on the ITV (left) and the recalculated dose distribution based on the CTV (right), boxplots of target dose parameters over all patients are shown as percentage of the presribed dose for both the IGART and the IGAPT strategy. Boxes represent upper and lower quartiles (IQR), the band inside the box the median value and the whiskers the highest (lowest) value within 1.5 IQR of the upper (lower) quartile. Horizontal dashed lines indicate 95% and 107% of the prescribed target dose.
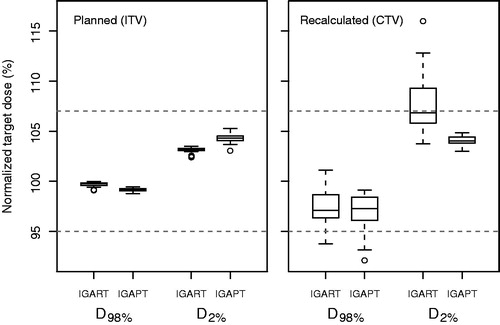
Figure 2. For Patient 1 (a–d) and Patient 5 (e–h), DVHs of recalculated fraction dose distributions are shown for target and OARs based on VMAT plans for the IGART strategy (solid lines) and IMPT plans for the IGAPT strategy (dotted lines). The intersection of the two solid black lines indicates V95%=98%. For one fraction of Patient 1 (b), IGAPT resulted in inadequate CTV coverage while CTV coverage using IGART was adequate.
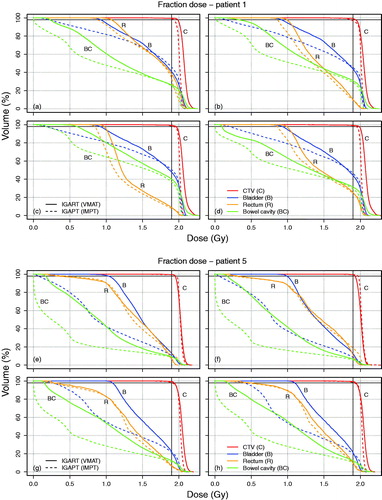
Figure 3. For bladder (upper), rectum (middle) and bowel cavity (lower), boxplots of fraction DVH parameters over all analyzed fractions of all patients are shown. Boxes represent upper and lower quartiles (IQR), the band inside the box the median value and the whiskers the highest (lowest) value within 1.5 IQR of the upper (lower) quartile. Horizontal lines including an asterisk indicate statistical significant difference (p < 0.01) based on a paired non-parametric statistical test.
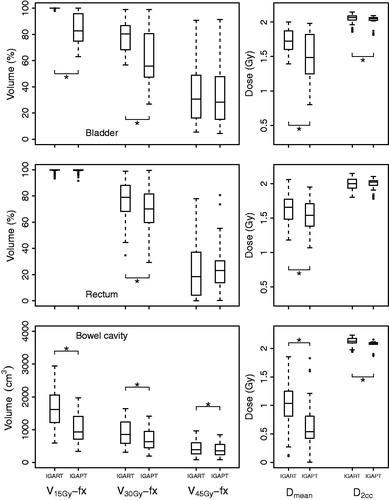
Table 1. Comparison of the mean dosimetric parameters for the recalculated fractions of all patients.