3,125
Views
20
CrossRef citations to date
0
Altmetric
Research Article

Multi-level modelling of longitudinal child growth data from the Birth-to-Twenty Cohort: a comparison of growth models

, , , &
Pages 168-179 | Received 11 Oct 2012, Accepted 13 Aug 2013, Published online: 11 Oct 2013

Figures & data

Table 1. Summary of some studies that have used structural and non-structural models to describe physical growth*.

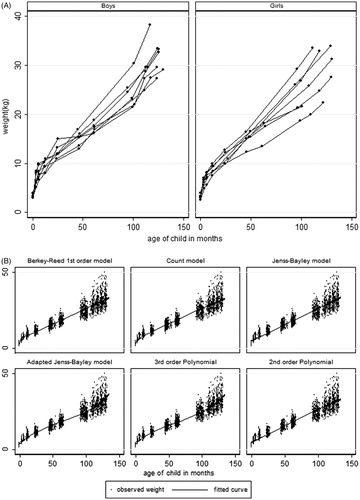
Table 2. Goodness-of-fit statistics from fitting growth models to weight measurements (in kg) from birth to 10 years.

Figure 1. Graphs of weight profiles and growth models fitted to weight from birth to 10 years.

Figure 1. Graphs of weight profiles and growth models fitted to weight from birth to 10 years.

Figure 2. Graphs of height profiles and growth models fitted to height from 3 months to 10 years.

Figure 2. Graphs of height profiles and growth models fitted to height from 3 months to 10 years.

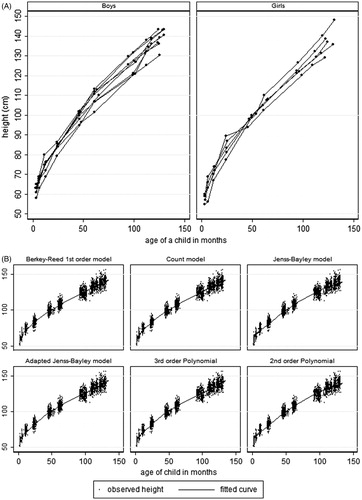
Table 3. Goodness-of-fit statistics from fitting growth models to height measurements (in centimetres) from 3 months to 10 years.

Supplemental material

Supplementary Material

Download PDF (38.7 KB)