Figures & data
Figure 1. The distribution of radial fusion grades from 1 (immature, white) to 6 (mature, black) by year of age in 496 footballers, from Dvorak et al. (Citation2007a). Age 18 is marked by the vertical red line.
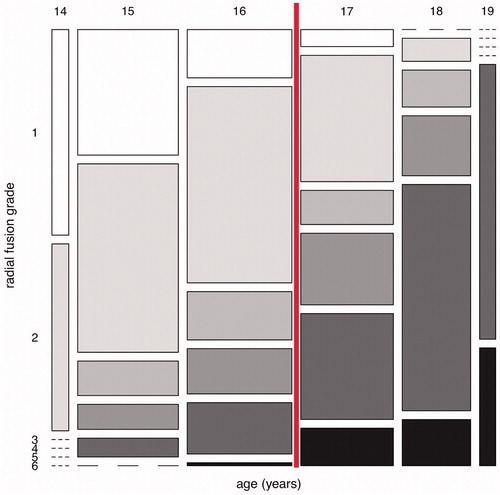
Table 1. Number (%) of 496 footballers graded as immature and mature by radial fusion status in 3-year age groups under and over 17.0 years, based on Dvorak et al. (Citation2007a). Percentages are by column.
Table 2. The proportions with a mature wrist scan among 189 international footballers from four U-17 competitions, based on Dvorak et al. (Citation2007b).
Figure 2. The distribution of Demirjian stages from A (immature, white) to H (mature, black) by year of age, for lower left third molars of 619 Korean males (Lee et al., Citation2009). Age 18 is marked by the vertical red line.
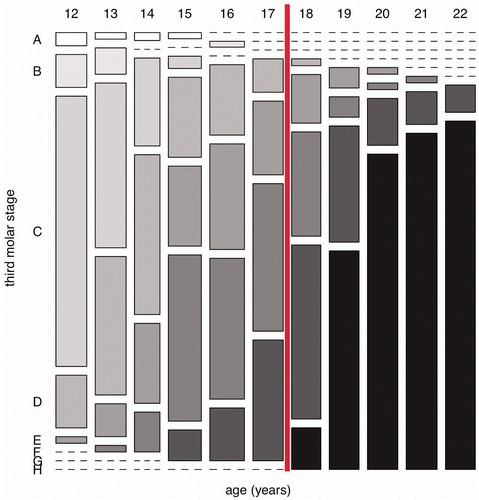
Figure 3. The distribution of Demirjian stages from B (immature, white) to H (mature, black) by year of age, for 804 lower third molars from 415 Texan Hispanic males (Kasper et al., Citation2009). Age 18 is marked by the vertical red line.
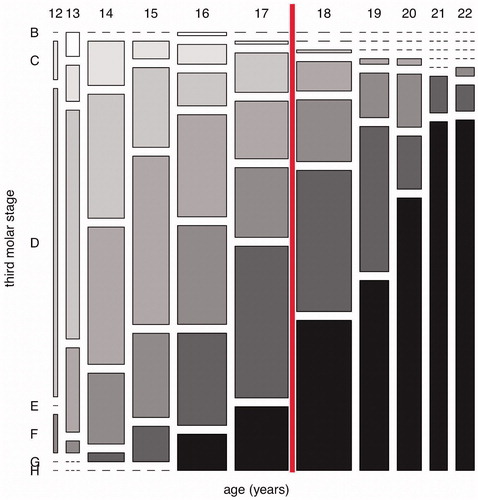
Table 3. Number (%) of subjects graded as immature and mature by lower third molar stage in 3-year age groups under and over 18.0 years, for Korean and Texan Hispanic males. Percentages are by column.
Table 4. Diagnostic test statistics for a mature lower third molar to detect age of majority. Results from seven population studies.
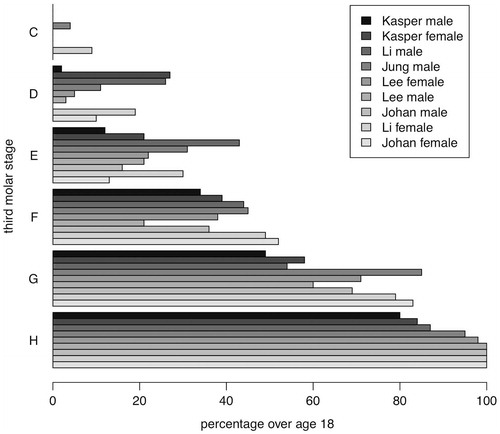
Figure 4. The proportions of individuals aged over 18 in Demirjian stages C–H, by study and sex. Studies are ranked by the values for stages H and G. Most individuals in stage H are over 18, while most in stage C are under 18; stages D–G are uninformative, in that individuals may be either under or over 18.