Figures & data
Table 1. Allocation of treatment to animals.
Table 2. Sequences of primer used in real time PCR.
Figure 1. Effect of A2B adenosine receptor antagonist (MRS1754) on (a) Blood Glucose; (b) Kidney weight/body weight; (c) Food intake; (d) Body weight in control and diabetic animals. Notes: Data are means (±SEM). *p < 0.05 versus control group #p < 0.05 versus diabetes group; n = 6.
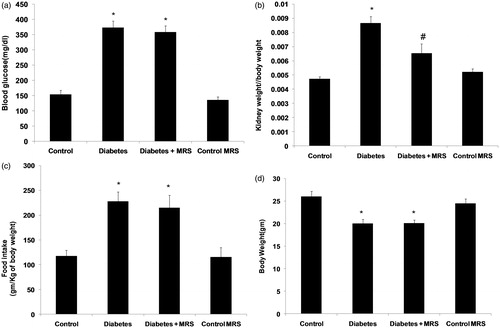
Figure 2. Effect of A2B adenosine receptor antagonist (MRS1754) on the renal functions in control and diabetic animals. (a) Serum creatinine; (b) Blood urea nitrogen; (c) Creatinine clearance; (d) Urinary albumin excretion. Results shown are the means ( ± SEM). Notes: *p < 0.05; #p < 0.05 versus Diabetes group; n = 6.
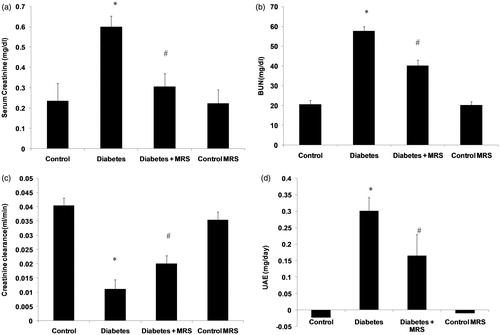
Figure 3. Real-time RT-PCR analysis of (a) A2B adenosine receptors and (b) VEGF mRNA level in kidney. RNA was isolated reverse-transcribed to cDNA, as described. The cDNA was then subjected to real-time PCR using specific primers and expression levels calculated and normalized to an internal control (GAPDH). (c) Correlation between expressions of both the genes (Pearson’s correlation). Notes: Data are means (±SEM). *p < 0.05 versus control group; #p < 0.05 versus diabetes group. n = 5.
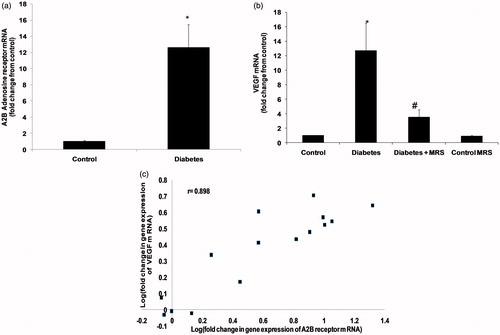
Figure 4. Effect of A2B adenosine receptor antagonist (MRS1754) on (a) plasma; (b) homogenate concentration of VEGF protein, measured by ELISA in different experimental groups. Notes: Data are means (±SEM). *p < 0.05 versus control group; #p < 0.05 versus diabetes group, n = 6.
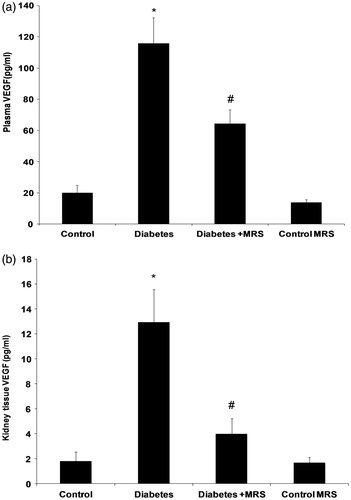
Figure 5. A2B adenosine receptor antagonist (MRS1754) on (a) kidney tissue (b) urine nitrite levels in control and diabetic mice. Notes: Data are means (±SEM). *p < 0.05 versus control group; #p < 0.05 versus diabetes group; n = 6.

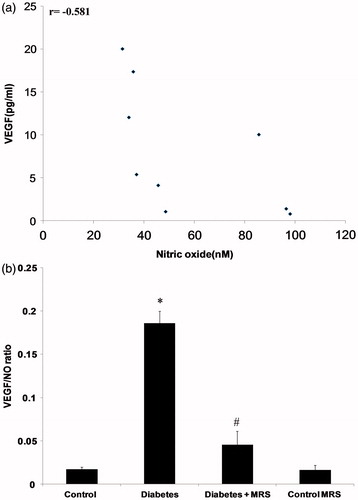
Figure 6. Masson trichrome staining of kidney tissue: (a) Control; (b) Diabetes; (c) Diabetes + MRS1754; (d) Control MRS1754. All images are representative glomeruli at an original magnification of 400×.
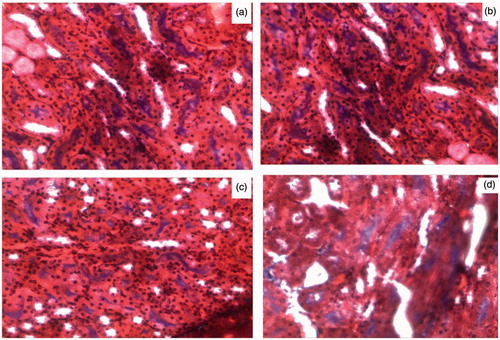
Figure 7. Glomerulosclerosis score in different experimental groups. Notes: Data are means (±SEM). *p < 0.05 versus control group; #p < 0.05 versus diabetes group; n = 6.
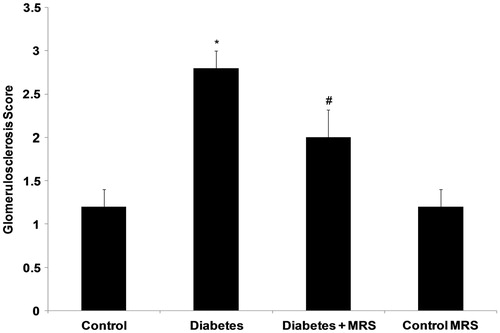
Figure 8. Effect of A2B adenosine receptor antagonist (MRS1754) on relative VEGF level in kidney tissue in different experimental groups. Notes: Data are means (±SEM). *p < 0.05 versus control group; #p < 0.05 versus diabetes group; n = 6.