Figures & data
Figure 1. The effects of chronic unpredictable stress and amantadine treatment on body weight (A), sucrose consumption percentage (B) and totail fliud intake (C). Data represent mean ± SEM. Error bars indicate SEM. *p < 0.05, **p < 0.01, ***p < 0.001, significant difference between the Con group and the Str group; #p < 0.05, ##p < 0.01, ###p < 0.001 significant difference between the Str group and the Str + AMA group. Con, control group (n = 6); Str, stress group (n = 9); Str + AMA, stress + amantadine treatment group (n = 9); Con + AMA, control + amantadine treatment group (n = 9).
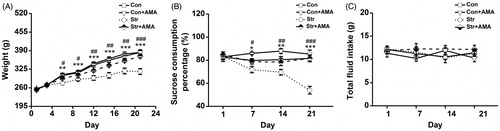
Figure 2. The performance of rats in the initial training (IT) stage and the space-exploring test (SET) stage of MWM experiment. (A) Mean escape latency was calculated for each day in the initial training. (B) Mean swimming speed in the IT stage. (C) Mean number of platform area crossings in the SET stage. (D) Mean percentage of time spent in target (NW) quadrant in the SET stage. Data represent mean ± SEM. Error bars indicate SEM. *p < 0.05, **p < 0.01, ***p < 0.001 comparison between the Con group and the Str group; #p < 0.05, ##p < 0.01, ###p < 0.001 comparison between the Str group and the Str + AMA group; the Con and stress groups, n = 12; the Str + AMA, n = 14; the Con + AMA, n = 6.
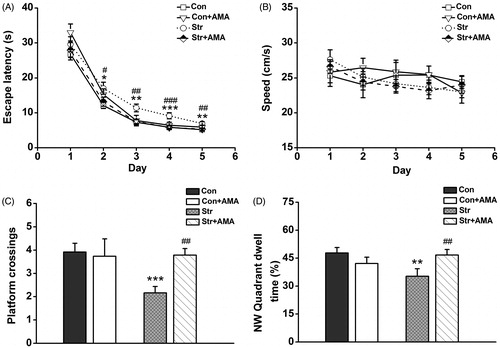
Figure 3. The performance of animals in the reversal training (RT) stage and the reversal exploring test (RET) stage of MWM experiment. (A) Mean escape latency was calculated for each day in reversal training. (B) Mean swimming speed in the RT stage. (C) Mean number of platform crossings in the RET stage. (D) Mean percentage of time spent in new target (SE) quadrant in the SET stage. Data represent mean ± SEM. Error bars indicate SEM. *p < 0.05, **p < 0.01, ***p < 0.001 comparison between the Con group and the Str group; #p < 0.05, ##p < 0.01, ###p < 0.001 comparison between the Str group and the Str + AMA group; the Con and Str groups, n = 12; the Str + AMA group, n = 14; the Con + AMA group, n = 6.
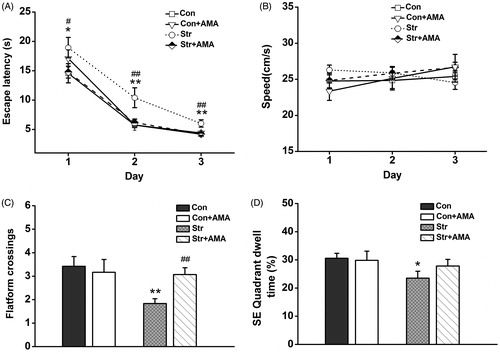
Figure 4. The effects of chronic unpredictable stress and amantadine treatment on the long-term potentiation and depotentiation from Schaffer collaterals to the hippocampal CA1. (A) The changes of time coursing in fEPSPs slopes in four groups. The first 20 min of evoked responses were normalized and used as the baseline responses of LTP. The last 15 min of evoked responses during LTP were normalized and used as the baseline responses of depotentiation. (B) Magnitude of LTP was determined as responses between 45 and 60 min after the TBS. (C) Magnitude of depotentiation was determined as responses between 45 and 60 min after low-frequency stimulation. Data represent mean ± SEM. *p < 0.05, **p < 0.01, ***p < 0.001 comparison between the Con group and the Str group; #p < 0.05, ##p < 0.01, ###p < 0.001 comparison between the Str group and the Str + AMA group; the Con, Str and Str + AMA groups, n = 7; the Con + AMA group, n = 4.
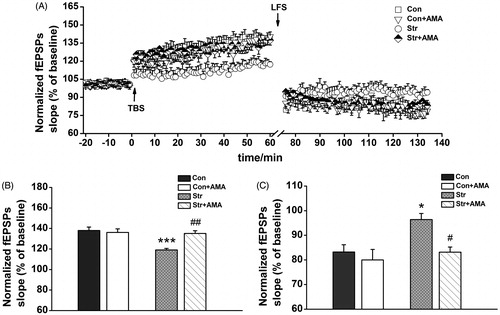
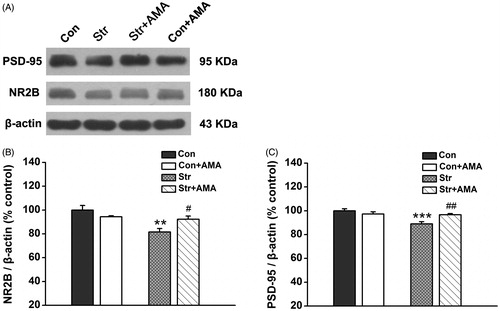
Figure 5. The effects of chronic unpredictable stress and amantadine treatment on expression of the NR2B and PSD-95 in the hippocampus. (A) Results are immunoblots from single representative experiments. (1) the Control group, (2) the Str group, (3) the Str + AMA group, (4) the Con + AMA group. The expression values of the NR2B (B) and the PSD-95 (C) were normalized with β-actin value, then compared to control. Data are presented as mean ± SEM. **p < 0.01, ***p < 0.001, comparison between the Con group and the Str group; #p < 0.05, ##p < 0.01, comparison between the Str group and the Str + AMA group; the Con, Str and Str + AMA groups: PSD-95, n = 7/group; NR2B, n = 8/group; the Con + AMA group: PSD-95/NR2B, n = 5.