Figures & data
Figure 1. Definitions of TSST stress response patterns. CV: coefficient of variation (*for a graphical representation of these parameters, see Supplementary Figure 1). ^Estimation of 7% plasma cortisol drop per hour due to circadian rhythm in the afternoon (Cizza et al., Citation2012; Selmaoui & Touitou, Citation2003); 7% salivary cortisol drop per hour (Heaney et al., Citation2012; Stone et al., Citation2001).
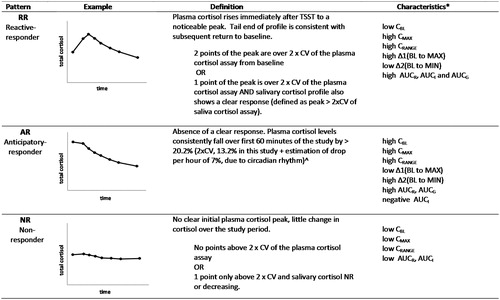
Table 1. Characteristics of Raine Study Trier Social Stress Test participants used in analyses.
Figure 2. TSST profiles with menstrual cycle, smoking, and obesity. Mean responses for ACTH, plasma cortisol, and salivary cortisol at each time point are shown with standard error bars.
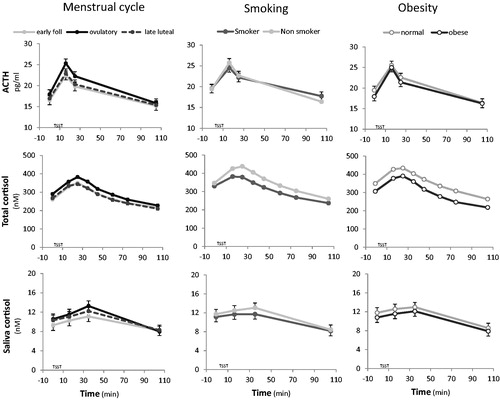
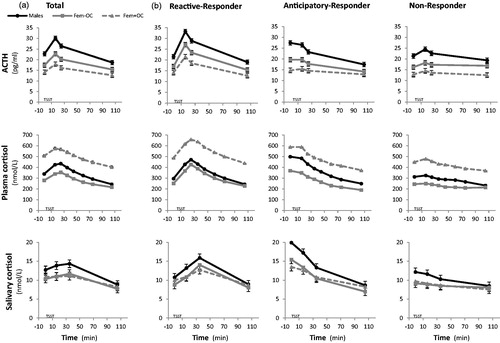
Figure 3. TSST response patterns by gender group. Mean responses for ACTH, plasma cortisol, and salivary cortisol at each time point are shown (a) with standard error bars for the total population and (b) separately for reactive, anticipatory, and non-responder patterns. Dark circles with solid lines represent males; gray squares with solid lines represent females not on OC; gray squares with dashed lines represent females taking OC.