Figures & data
Figure 1. Comparison of three-dimensional structures of EPSPS from plants and bacteria. The X-ray crystal structures of the EPSPS from E. coli and Agrobacterium CP4 were used to generate homology models of the EPSPS from canola, maize, rice, and soy using SwissModel. The plant enzymes have ∼90% sequence identity with each other and are ∼50% identical to the bacterial enzymes. Secondary structure corresponding to α-helices and β-strands are colored blue and gold, respectively. The position of glyphosate (from the E. coli and CP4 crystal structures) is modeled as a space-filling molecule (red) into each structure to show the active site location.
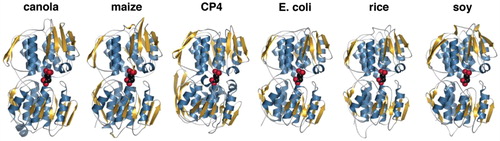
Table 1. Amino acid sequence similarities between the 2mEPSPS protein and EPSPS from various crops.
Table 2. Bioinformatics resources.
Figure 2. Cytochrome c oxidase structural homology. Comparison of the three-dimensional structures and active sites of cytochrome c oxidases from various species. Overall structure is shown as a ribbon diagram. Invariant residues (gold spheres) that maintain the position of the catalytic heme-group (rose spheres) are highlighted.
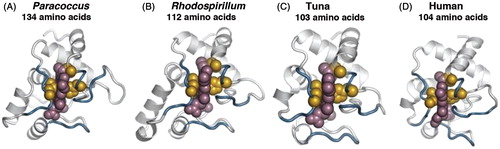
Figure 3. Variety of protein structures. Examples of different types of proteins are shown to highlight variations in secondary, tertiary, and quaternary structures. In panel A, the gold space-filling model represents DNA and the green ribbon diagram the protein. In panel B, each subunit of the proteasome is colored differently. In panel C, the monomeric structure of porin is shown as a ribbon diagram. In panel D, the viral peptide is shown as the brown space-filling model and the major histocompatibility complex (MHC) molecule as a ribbon diagram.
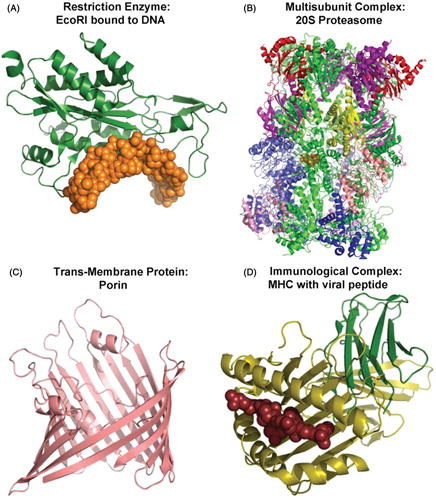
Table 3. Impact of heating on functional activity of introduced proteins and food processing enzymes.
Table 4. Impact of food processing on functional activity of introduced proteins and food processing enzymes.