Figures & data
Table 1. Experimental trials and interactions transformed into code units.
Table 2. Experimental trials and response in terms of size and zeta potential for O15 and O25 UOC.
Table 3. Effects and interactions on size and zeta potential of the UOC/pCMS-EGFP polyplexes.
Figure 1 Acid–base titration profiles of O15 UOC, O25 UOC and G214 chitosan in 150 mM NaCl solution.
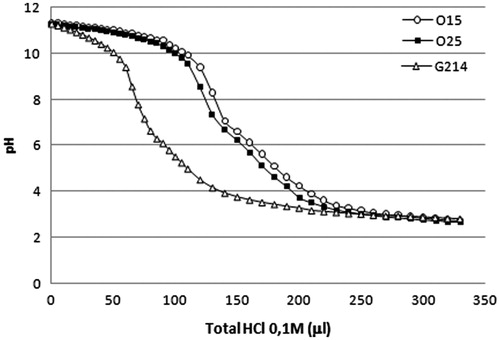
Figure 2 EGFP expression and cell viability in HEK293 cells after the transfection with O15 and O25 UOC/pCMS-EGFP polyplexes at N/P ratios from 10 to 60. Transfection data were normalized to Lipofectamine 2000™.
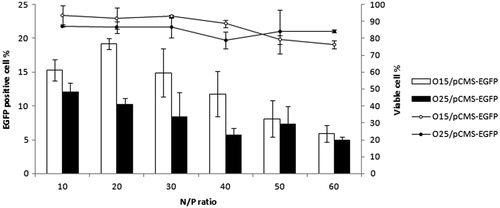
Figure 3 Size and zeta potential of O15 and O25 UOQ/pCMS-EGFP and G214/pCMS-EGFP polyplexes (N/P ratio of 20) at pH 7.4 and 6.5.
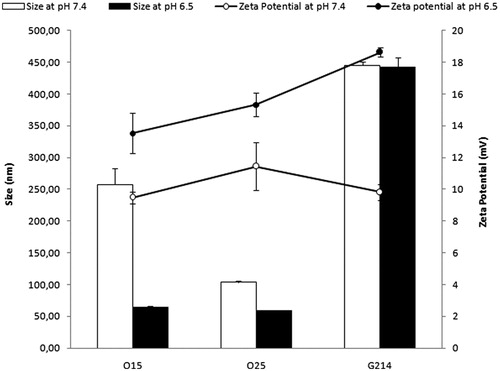
Figure 4 Cellular uptake of FITC-labeled pCMS-EGFP delivered by UOC polyplexes (N/P = 20). Percentage of FITC-positive cells treated with O15 and O25 UOC and G214 chitosan at pH 6.5 and 7.4 in HEK293 (A1) and ARPE19 (A2) cell lines. Fluorescent images of FITC-pCMS-EGFP uptake: O15 UOC/FITC-pCMS-EGFP at pH 7.4 in HEK293 (B1); O25 UOC/FITC-pCMS-EGFP at pH 7.4 in HEK293 (B2); G214/FITC-pCMS-EGFP at pH 7.4 in HEK293 (B3); O15 UOC/FITC-pCMS-EGFP at pH 6.5 in HEK293 (B4); O25 UOC/FITC-pCMS-EGFP at pH 6.5 in HEK293 (B5); G214/FITC-pCMS-EGFP at pH 6.5 in HEk293 (B6); O15 UOC/FITC-pCMS-EGFP at pH 7.4 in ARPE19 (B7); O25 UOC/FITC-pCMS-EGFP at pH 7.4 in ARPE19 (B8); G214/FITC-pCMS-EGFP at pH 7.4 in ARPE19 (B9); O15 UOC/FITC-pCMS-EGFP at pH 6.5 in ARPE19 (B10); O25 UOC/FITC-pCMS-EGFP at pH 6.5 in ARPE19 (B11); G214/FITC-pCMS-EGFP at pH 6.5 in ARPE19 (B12).
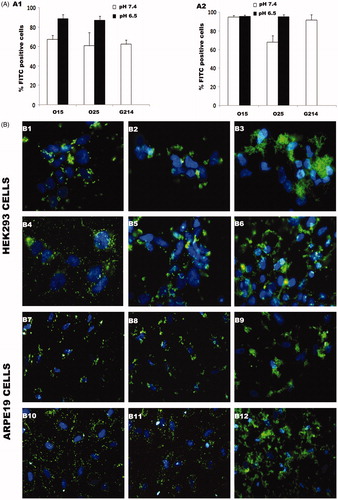
Figure 5 Transfection efficiency of O15 and O25 UOC/pCMS-EGFP polyplexes (N/P = 20) at different pH values in HEK293 (A1) and ARPE19 cells (A2). Transfection data were normalized to Lipofectamine 2000™. Flow cytometry histograms (FL1/events) comparing transfection efficiencies at pH values of 6.5 and 7.4: HEK293 cells transfected with O15 UOC/pCMS-EGFP polyplexes (B1); HEK293 cells transfected with O25 UOC/pCMS-EGP polyplexes (B2); ARPE19 cells transfected with O15 UOC/pCMS-EGFP polyplexes (B3); ARPE19 cells transfected with O25 UOC/pCMS-EGFP polyplexes (B4). Overlay of phase contrast image with fluorescent illumination (GFP channel) to evaluate transfection efficiency: HEK293 cells transfected with O15 UOC vectors at pH 7.4 (C1); HEK293 cells transfected with O15 UOC vectors at pH 6.5 (C2); HEK293 cells trasnfected with O25 UOC vectors at pH 7.4 (C3); HEK293 cells transfected with O25 UOC vectors at pH 6.5 (C4); ARPE19 cells transfected with O15 UOC vectors at pH 7.4 (C5); ARPE19 cells trasnfected with O15 UOC vectors at pH 6.5 (C6).
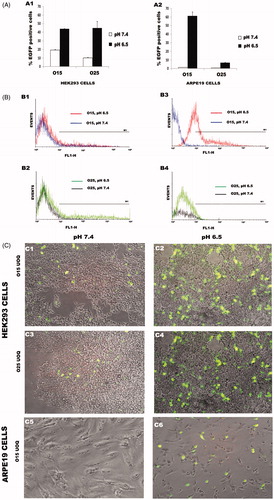
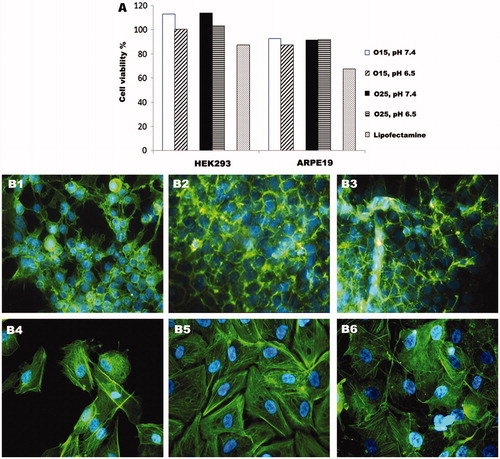
Figure 6 Cell viability and morphology of HEK293 and ARPE19 cells after transfection with O15 and O25 UOC vectors (N/P = 20) and Lipofectamine 2000™. Influence of pH on cell viability of HEK293 and ARPE19 cells by CCK-8 assay (A). Phalloidin and DAPI staining of HEK293 and ARPE19 cells after 4 h transfection; HEK293 cells transfected with O25 UOC vectors at pH value of 6.5 (B1); HEK293 cells tranfected with O25 UOC vectors at pH value of 7.4 (B2); HEK293 cells transfected with Lipofectamine 2000™ (B3); ARPE19 cells transfected with O25 UOC vectors at pH value of 6.5 (B4); ARPE19 cells transfected with O25 UOC vectors at pH value of 7.4 (B5); ARPE 19 cells transfected with Lipofectamine 2000™ (B6).