Figures & data
Figure 1. Serum concentration–time profiles of α-MMC and α-MMC-PEG in SD rats after a single iv bolus injection.
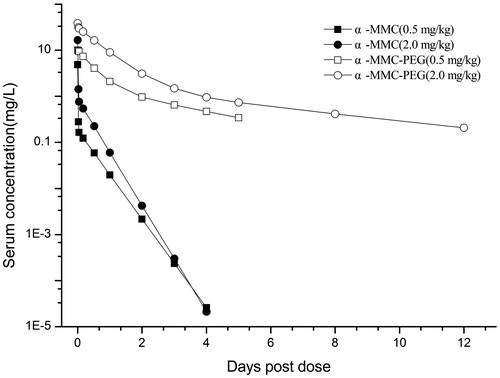
Table 1. Pharmacokinetic parameters of α-MMC and α-MMC-PEG in serum of SD rats after a single iv bolus injection.
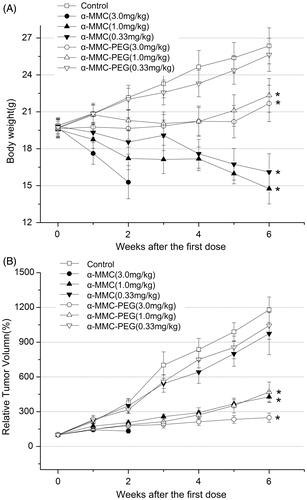
Figure 2. Antitumor effects of repeated ip dose of α-MMC or α-MMC-PEG against EMT-6 mouse mammary carcinoma tumor in male Balb/C mice. Eight mice were used for each group. (A) body weight. (B) Tumor growth, expressed as the mean ± SD of relative tumor volume (%). ‘*’– p < 0.05, compared to control group.
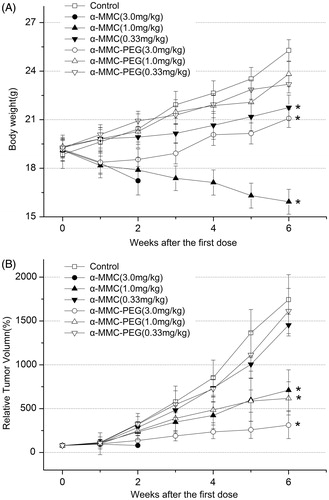
Table 2. Antitumor activity of α-MMC and α-MMC-PEG on EMT-6 rat breast cancer in vivo (x ± s; n = 8).
Figure 3. Antitumor effects of repeated ip dose of α-MMC or α-MMC-PEG against MDA-MB-231 human mammary carcinoma tumor in female Balb/C nude mice. Eight mice were used for each group. (A) body weight. (B) Tumor growth, expressed as the mean ± SD of relative tumor volume (%). ‘*’– p < 0.05, compared to control group.