Figures & data
Table 1. Variables and their constraints in the Box–Behnken design.
Table 2. Box–Behnken experimental design data for RAS nanoparticles (n = 3 ± SD).
Figure 1. Effect of independent variables on (a) particle size (PS), (b) PDI and (c) entrapment efficiency (EE).
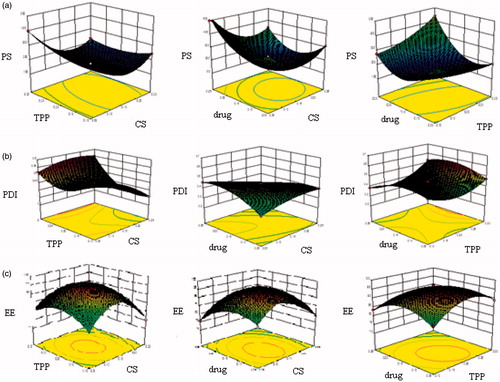
Table 3. Predicted and experimental values obtained based on optimized formula generated by Design Expert Software (n = 3 ± SD).
Figure 2. Particle size distribution of optimized RAS-loaded nanoparticles (a) PCS (b) TEM.
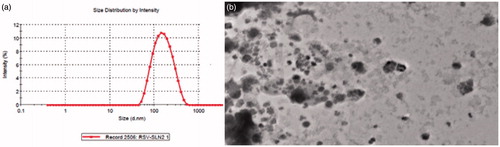
Figure 3. DSC thermogram of (a) RAS, (b) chitosan glutamate (CG), (c) physical mixture of drug and polymer (1:1) and (d) RAS-loaded CG-NPs.
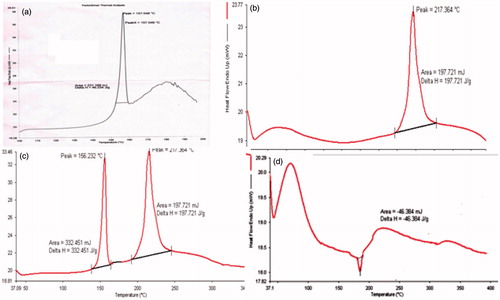
Figure 4. In vitro release profile of RAS-loaded CG-NPs and RAS solution (n = 3 ± SD).
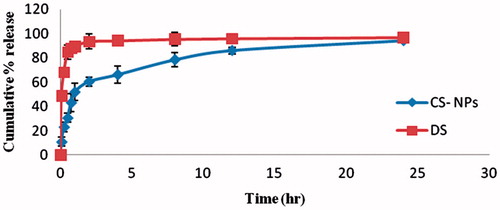
Figure 5. The mean (A) brain and (B) blood concentration–time graph of RAS in mice at different time intervals following RAS solution (i.n.), RAS-loaded CG-NPs (i.n.) and RAS-loaded CG-NPs (i.v.) administrations (n = 3 ± SD).
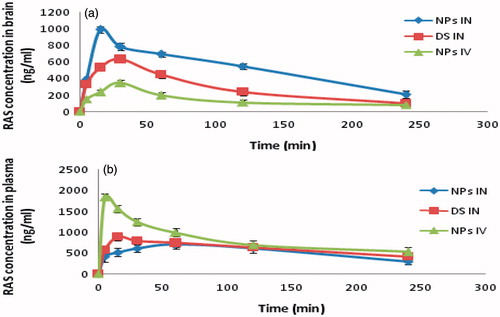
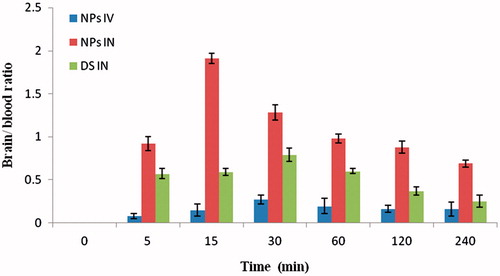
Figure 6. Brain–blood ratio at different time interval by RAS CG-NPs (i.n.), RAS CG-NPs (i.v.) and RAS solution (i.n.) in mice (n = 3 ± SD).