Figures & data
Figure 1. Scheme of preparing M-C-PLA-NPs coated with various kinds of materials.
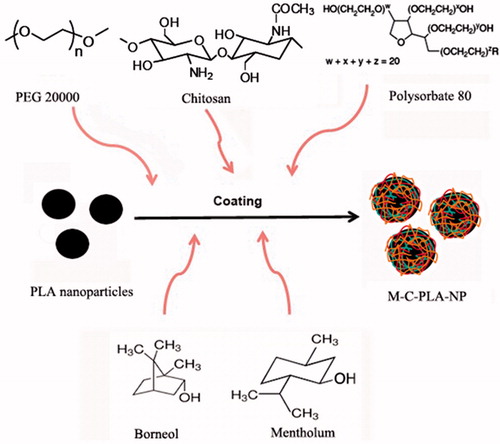
Figure 2. Scanning electron micrographs of M-C-PLA-NP (105 × magnification, A); Size distribution chart of M-C-PLA-NP (B) and Zeta potential distribution chart of M-C-PLA-NP (C).
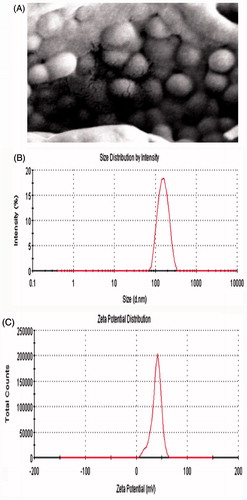
Figure 3. Scanning electron micrograph of M-C-PLA-NP after lysozyme incubated for 2 h (105 × magnification, A) and Size distribution chart of M-C-PLA-NP after lysozyme incubated for 2 h (B).
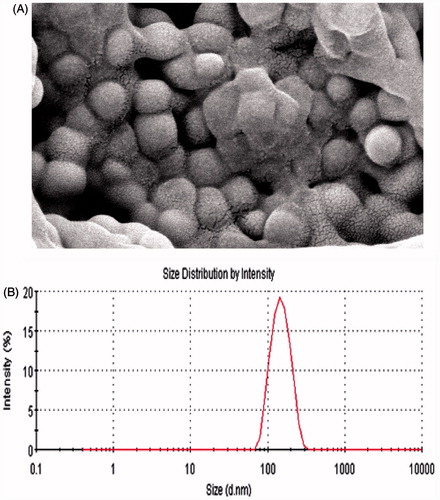
Figure 4. The curve of M-C-PLA-NP cumulative release percentage in pH 7.4 or pH 4.0 PBS. Data represented the mean ± SD.
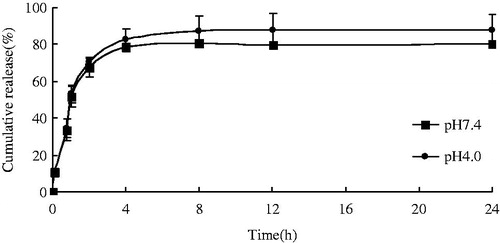
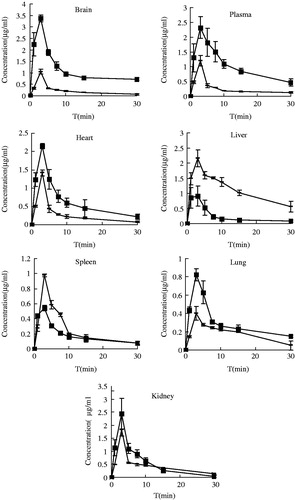
Figure 5. Different tissues concentration-time profiles of aniracetam following nasal administration of M-C-PLA-NP (▪) and aniracetam solution (—) at a dose of M-C-PLA-NP of 50 µl (aniracetam content of 6.667 mg/ml). Data represented the mean ± SD.