Figures & data
Figure 1. Scanning electron photomicrographs of crosslinked dextran microspheres.
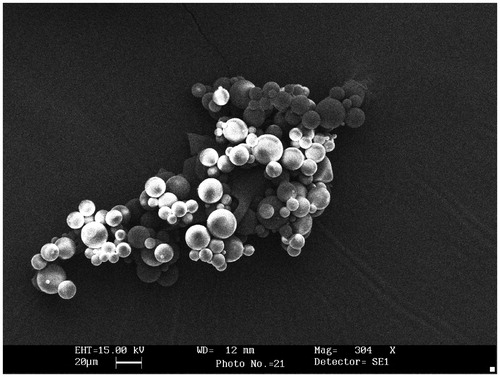
Table 1. Effect of fabrication variables on mean diameter, entrapment efficiency and in vitro drug release of uncoated GA crosslinked dextran microspheres.
Figure 2. Effect of molecular weight on drug release from crosslinked dextran microspheres (bars represent mean ± SD, n = 3).
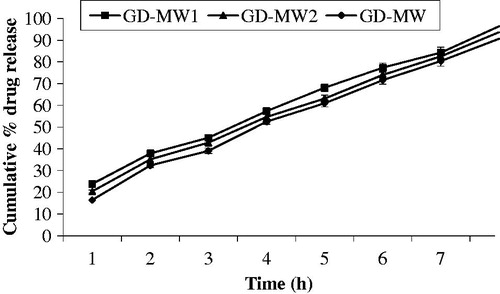
Figure 3. Scanning electron photomicrographs of Eudragit-S-100-coated crosslinked dextran microspheres.
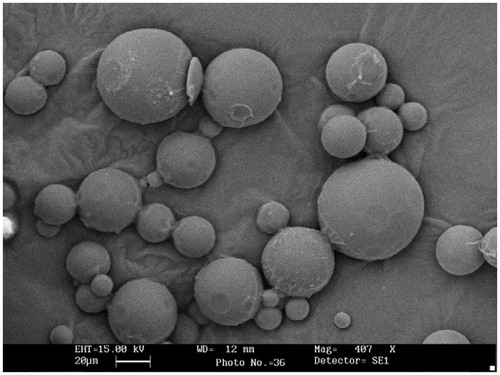
Table 2. Particle size and entrapment efficiency of various Eudragit-coated crosslinked dextran microspheres.
Figure 4. DSC thermogram of (a) 5-FU (b) dextran (c) GA crosslinked dextran microspheres (d) Eudragit-S-100 (8:1) coated 5-FU-loaded crosslinked dextran microspheres.
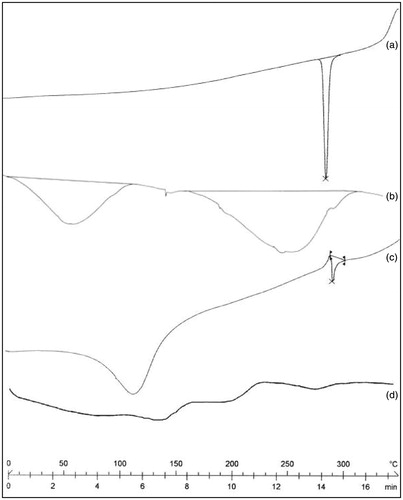
Figure 5. In vitro drug release from coated dextran microspheres (bars represent mean ± SD, n = 3).
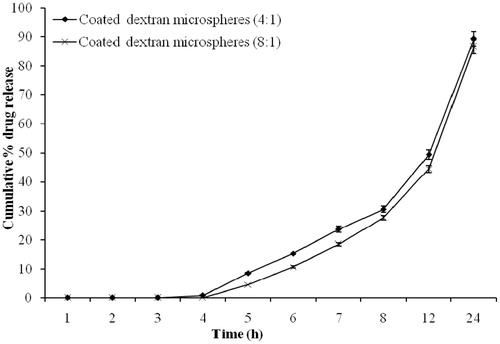
Figure 6. In vitro drug release from coated dextran microspheres in the presence of dextranase (bars represent mean ± SD, n = 3).
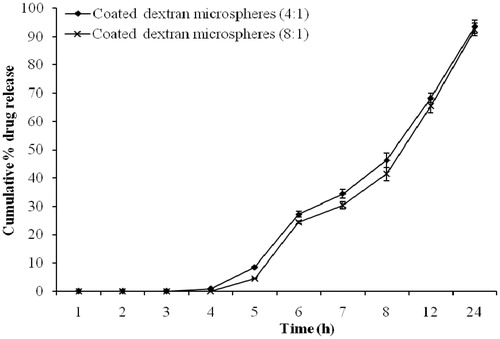
Figure 7. In vitro drug release from coated dextran microspheres in the presence of 2% rat cecal contents (bars represent mean ± SD, n = 3).
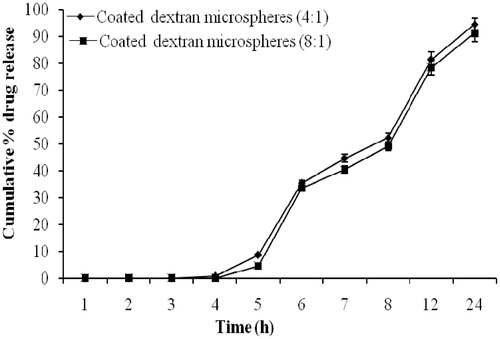
Table 3. Pharmacokinetic parameters of 5-FU after administration of plain 5-FU solution and 5-FU-loaded coated dextran microspheres in rats.
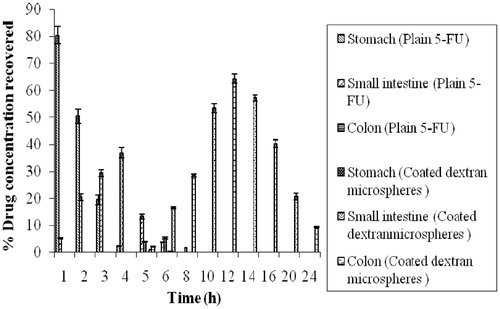
Figure 8. Organ distribution of plain 5-FU solution and 5-FU-loaded coated dextran microspheres after oral administration (bars represent mean ± SD, n = 3).