Figures & data
Table 1. Variables and their levels in the Box–Behnken design.
Table 2. Experimental runs and observed values of responses for BBD.
Figure 1. The phase solubility diagrams of sildenafil citrate with different concentrations of the three β-cyclodextrin carriers.
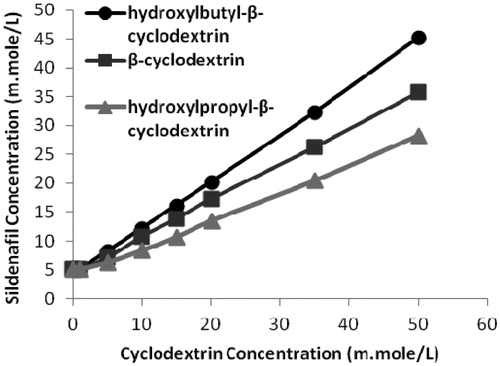
Table 3. Factor effects and associated p values for Y1 and Y2 responses.
Table 4. Regression Equations of the fitted models.
Figure 2. (A) Response surface plot (3D) showing the effect of X1 and X3 on Y1. (B) contour plot showing relationship between various levels of two variables to attain fixed values of Y1. (C) Response surface plot (3D) showing the effect of X1, X2, and X3 on Y2. (D) Contour plot showing relationship between various levels of two variables to attain fixed values of Y2.
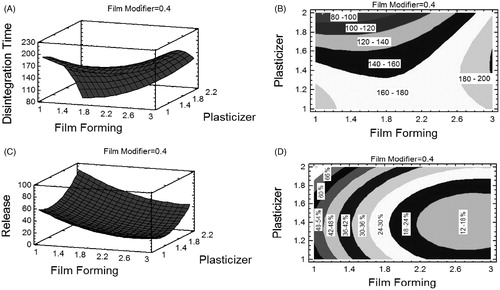
Table 5. Optimum desirability with observed values of the responses for the optimized sildenafil citrate ODFs formulation.
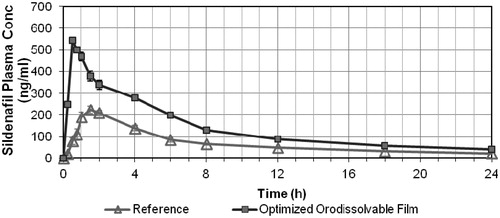
Figure 3. Plasma concentration of Sildenafil citrate following the administration of the reference (Viagra® tablets), and optimized ODF. Data represent the mean values of n = 6 ± S.D.