Figures & data
Table 1. Preparation of ATV NPs as per the experimental design.
Figure 1. Response surface plot showing the influence of TTAB (surfactant) and Eudragit RL 100 (polymer) on (A) particle size (Dnm), (B) drug encapsulation efficiency (DEE) and (C) mean percent drug release in 24 h (%Rel24h) for NPs formulations of ATV.
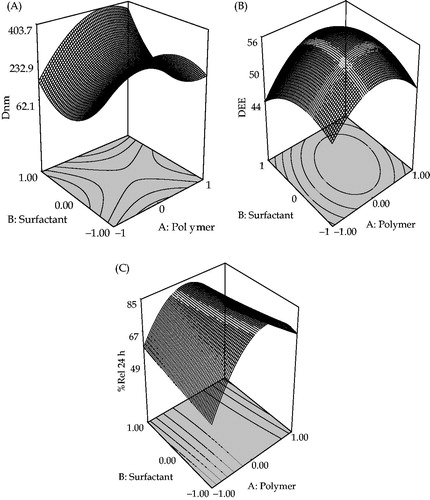
Figure 2. In vitro release profile of ATV loaded Eudragit RL 100 NPs with TTAB as surfactant in pH 7.4 phosphate buffer. Data points shown are mean ± standard deviation (SD) (n = 3).
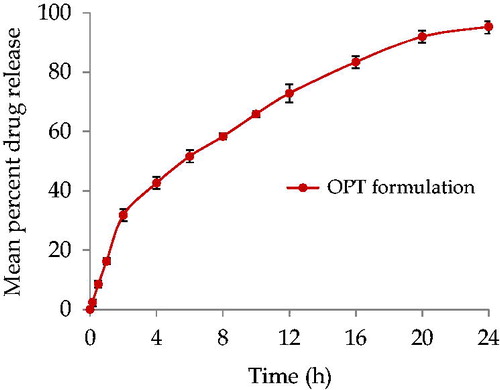
Figure 3. TEM image shows particle size of OPT formulation.
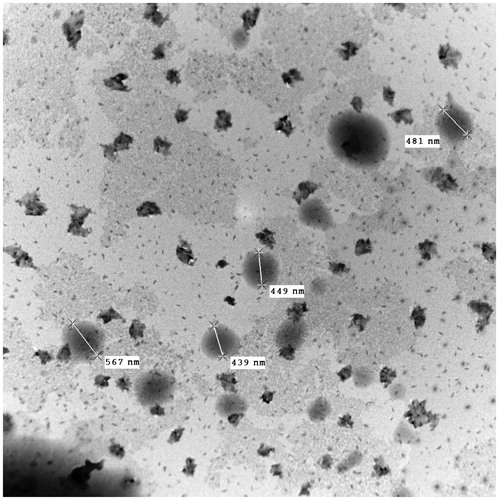
Figure 4. Plasma drug level profiles of pure drug and OPT formulation. Each point represents mean of six replicates and each cross bar indicates 1 SEM.
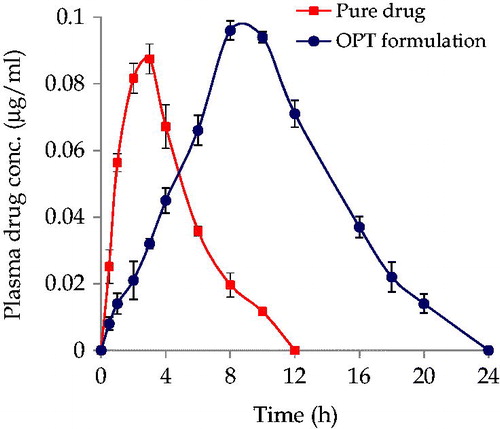
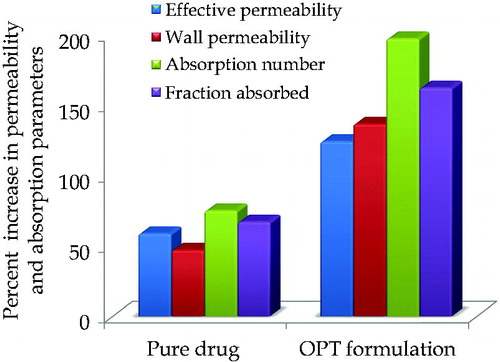
Figure 5. Percent increase in permeability parameters and absorption parameters in OPT formulation vis-à-vis pure drug using in situ single pass intestinal perfusion technique.