Figures & data
Figure 1. The structure of ACM (A) and Quercetin (B, internal standard).
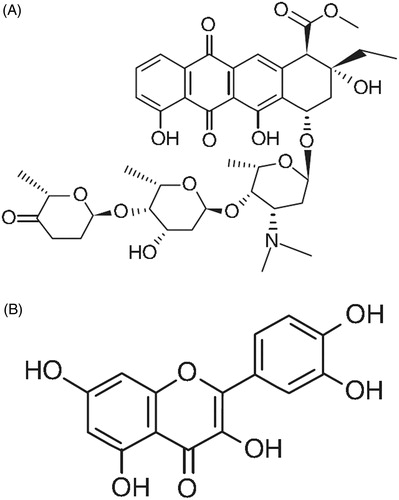
Figure 2. Transmission electron microscope photograph of ACM-SLNs. × 3000.
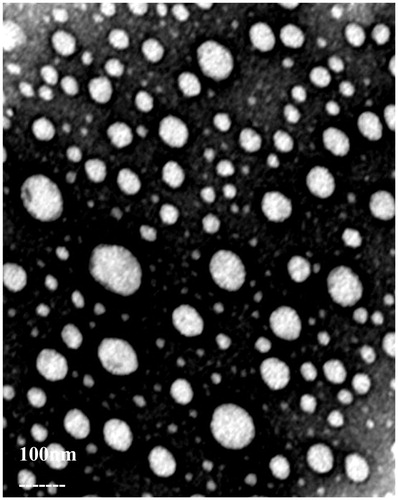
Figure 3. DSC analyses of the samples: (A) ACM, (B) blank SLNs, (C) physical mixture of ACM and blank SLNs, (D) ACM-SLNs.
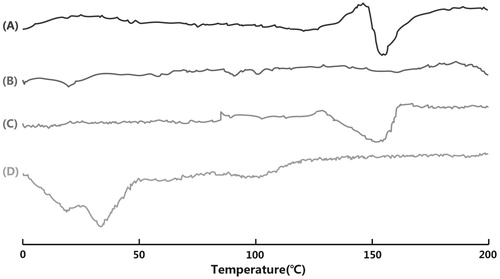
Figure 4. X-ray diffraction spectra of (A) ACM, (B) physical mixture of ACM and blank SLNs, (C) blank SLNs, and (D) ACM-SLNs.
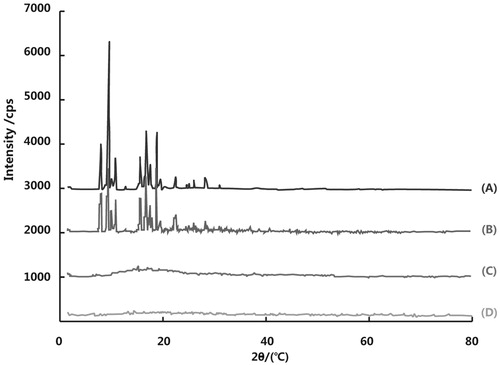
Figure 5. In vitro release profiles of ACM-SLNs from three batches. Release experiments were carried out in phosphate buffer solution (PBS) (pH 7.4), at 37 ± 0.5 °C. Each point represents the mean value of three different experiments ± SD ⋄, free ACM; △, ACM-SLNs; *p < 0.05 free ACM versus ACM-SLNs.
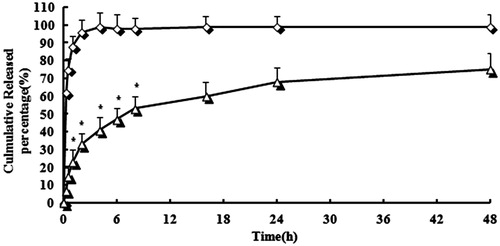
Table 1. Correlation coefficients for kinetic analysis of release data for ACM-SLNs.
Figure 6. Mean plasma concentration–time profiles of ACM after i.v. administration of a single 10 mg/kg dose of free ACM and ACM-SLNs to rats. The values are expressed as mean ± SD (n = 6).
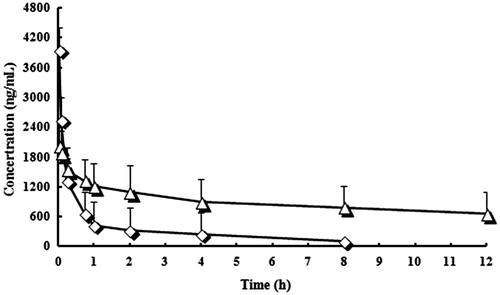
Table 2. Pharmacokinetic parameters of the two formulations.
Figure 7. Distribution in tissue in rats after following i.v. administration of a single 10 mg/kg dose of ACM injection tissues (ng/g) (each point represents the mean ± SD of six rats).
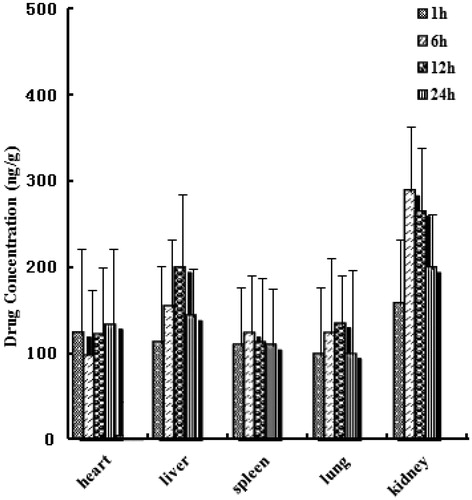
Figure 8. Distribution in tissue in rats after following i.v. administration of a single 10 mg/kg dose of ACM-SLNs tissues (ng/g) (each point represents the mean ± SD of six rats).
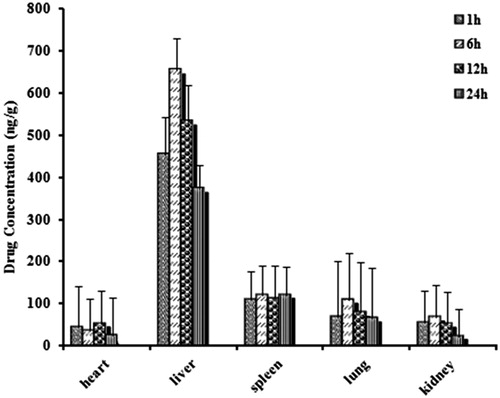
Table 3. The AUC0 − 24 h of ACM in tissues after i.v. administration of injection and SLNs to rats.
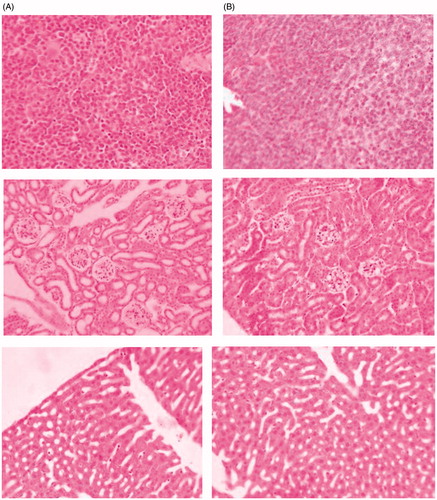
Figure 9. Histopathological studies of liver, spleen, and kidney. (A) Free ACM and (B) ACM-SLNs.