Figures & data
Table 1. Composition of vesicular formulation and their characterizations.
Table 2. Characterization of selected formulations and gel (EL3-S80 gel).
Figure 1. Leica optical microscopy of formulation (400×). (a) Blank elastic liposome and (b) optimized 5-FU loaded elastic liposome (without sonication).
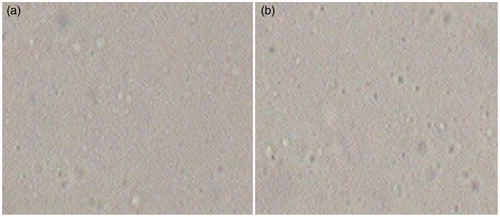
Figure 2. Vesicular size and zeta potential distribution of an optimized EL3-S80 formulation.
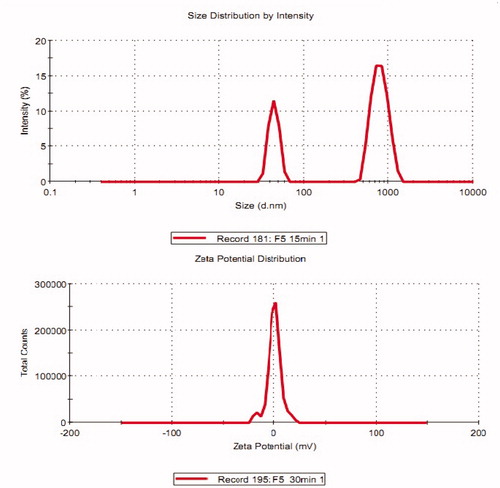
Figure 3. Formulations showing no. of vesicles per cubic mm (×1000) and turbidity value.
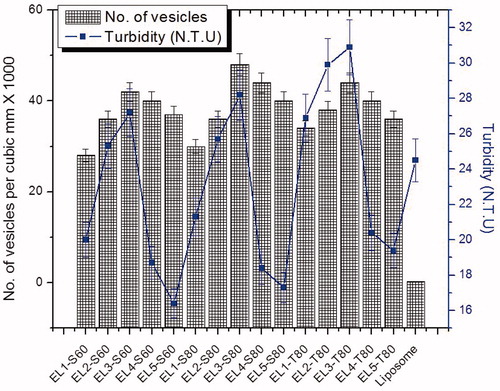
Figure 4. SEM photograph showing globular vesicle of lyophilized elastic liposome EL3-S80 (a) and transmission electron micrograph (TEM) of optimized elastic liposome formulation. Magnification: ×15 000.
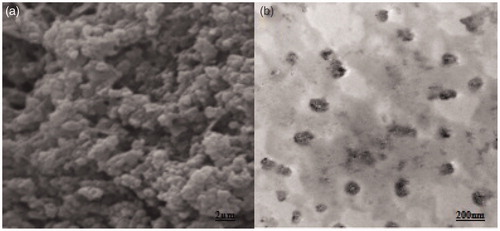
Figure 5. Percentage release of 5-FU through dialysis membrane.
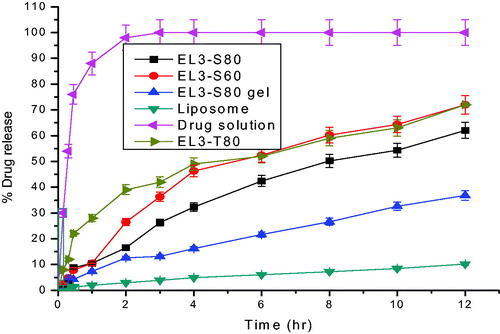
Figure 6. Percentage cumulative amount of 5-FU permeated through albino rat skin over a period of 24 h.
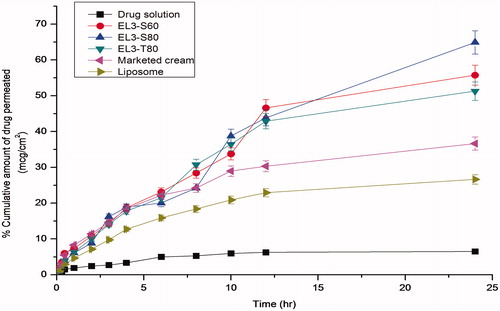
Table 3. In vitro permeation parameters of different 5-FU formulations across the albino rat skin after 24 h.
Figure 7. Drug deposited into the skin after treatment with different formulations.
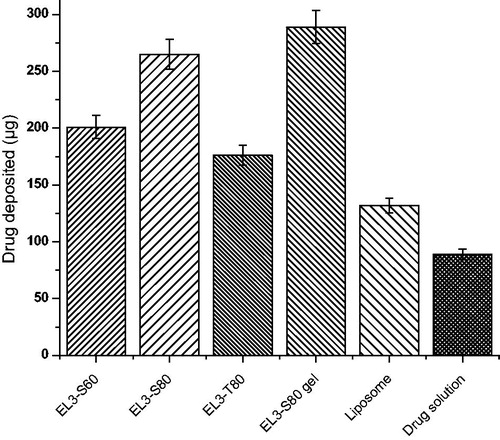
Figure 8. In vitro RBCs lysis of elastic liposome formulation loaded with 5-FU and drug solution.
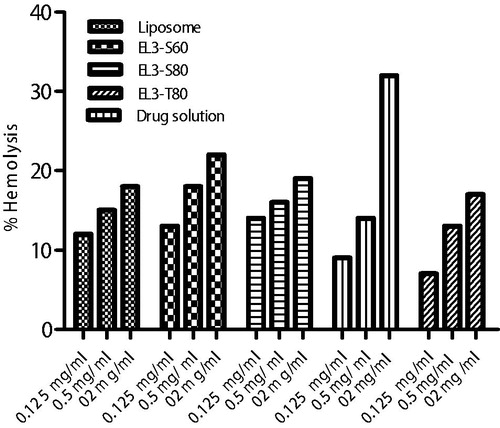
Table 4. Mean erythemal and edema scores observed at the end of 1, 24, 48 and 72 h.
Figure 9. CLSM photomicrographs of cross-sections of hairless viable rat skin incubated on Franz diffusion cell with elastic liposome containing probe RR for 24 h, sectioned 0.5 μm below the cutting surface: (a) skin treated with EL3-S80-RR (0.5% w/v) and (b) skin treated with drug loaded EL3-S80-RR. Lens with magnification of 40× (immersion objective); excitation: 488 nm; emission: 560 nm.
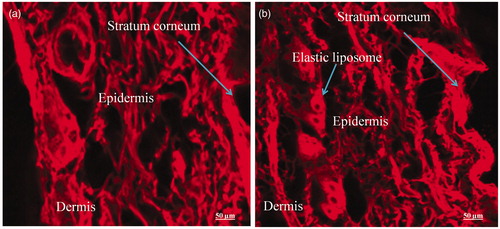
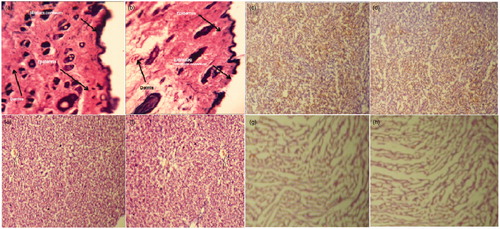
Figure 10. Representative histopathological sections of various organs of mice showing effect of in vivo topical application of 5-FU gel formulation in 28-d dermal toxicity study. (a) Control skin (40×), (b) treated skin, (c) control kidney, (d) treated kidney, (e) control liver, (f) treated liver, (g) control heart and (h) treated heart (10× for all other organs). Tissue sections were stained with hematoxylin and eosin.