Figures & data
Table 1. Standard curves, correlation coefficient and linear range of DOC in plasma and tissues of mice.
Table 2. The inter-(n = 5) and intra (n = 5)-day precision and recovery of the method for determination of DOC in plasma and tissues samples.
Table 3. Entrapment efficiency, particle size and zeta-potential of freshly prepared liposome suspensions.
Table 4. Pharmacokinetic parameters of DOC-i, DOC-L and G-DOC-L in rat plasma following intravenous administration (n = 5).
Figure 1. Mean plasma concentration of DOC in rat after i.v. administration of DOC-i, DOC-L and G-DOC-L at dose to 2.5 mg/kg of DOC (mean ± SD; n = 5).
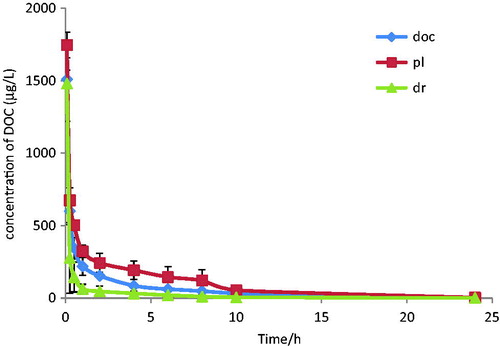
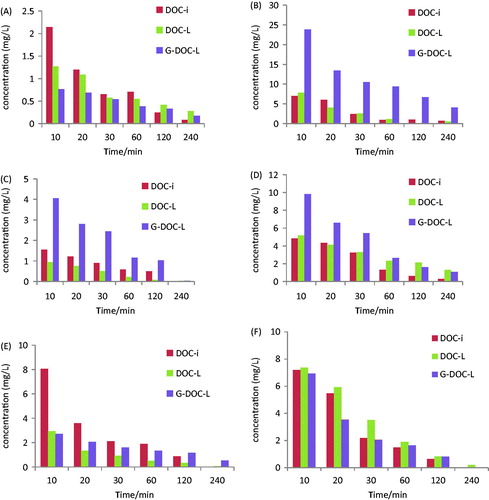
Figure 2. Concentration–time profile of DOC in heart (A), liver (B), spleen (C), lung (D), kidney (E) and plasma (F) of mice after i.v. administration of DOC-i, DOC-L and G-DOC-L at dose to 3.5 mg/kg of DOC (n = 5).
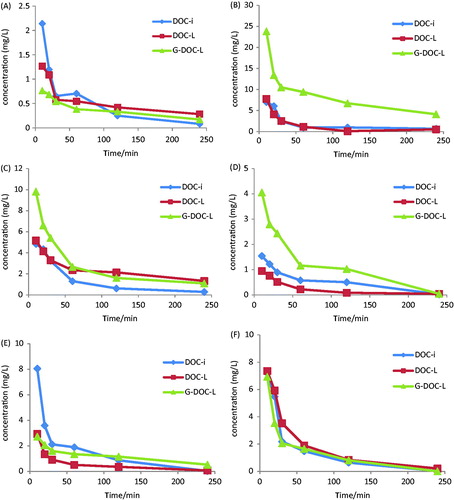
Figure 3. Concentration of DOC in heart (A), liver (B), spleen (C), lung (D), kidney (E) and plasma (F) of mice at various time points after i.v. administration of DOC-i, DOC-L and G-DOC-L at dose to 3.5 mg/kg of DOC (n = 5).