Figures & data
Table 1. Size, polydispersity and zeta potential of non-targeted and targeted liposomes.
Figure 1. TEM images of (A) non-targeted and (B) targeted Epirubicin-HCl liposomes.
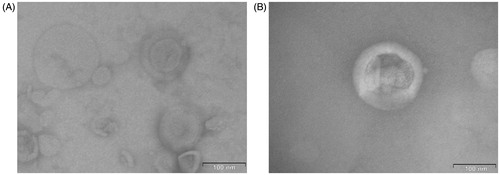
Figure 2. SDS-PAGE analysis of transferrin-conjugated liposomes.
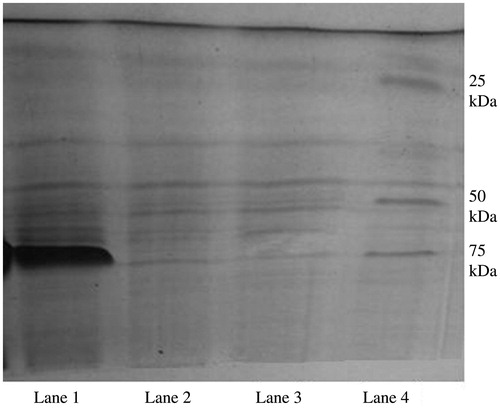
Figure 3. (A) Drug release study of liposomal formulation at pH 5.5, pH 6.5, pH 7.5 and in plasma; (B) plot of absorbance versus sodium sulfate concentration demonstrating electrolyte induced flocculation of the non-targeted and targeted liposomes; (C) serum stability study of formulated liposomes.
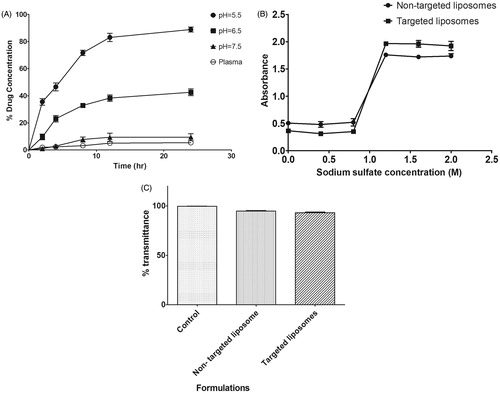
Figure 4. (A) Relative haemolytic potentials of different formulations; (B) heme compatibility study representing the image of RBCs after their incubation with respective formulation for 1 hr.
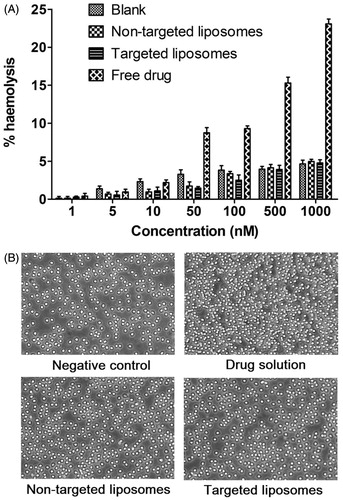
Figure 5. (A) Relative cell viability of free drug, non-targeted and targeted liposomal formulations; (B) cell uptake study of different formulations-free rhodamine; non-targeted liposomal formulation and targeted liposomes.
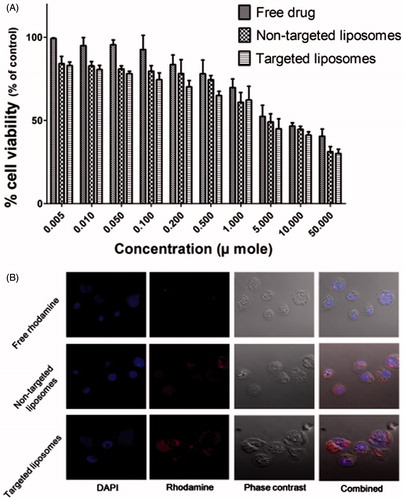
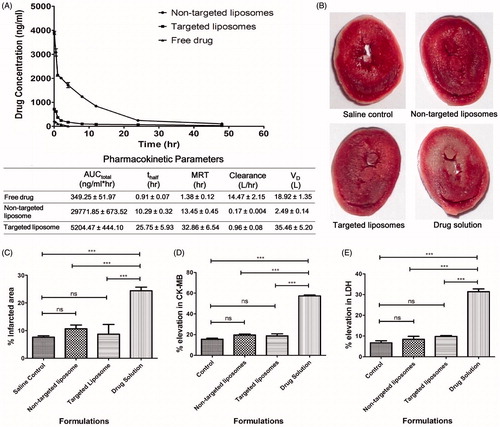
Figure 6. (A) Plasma concentration versus time profile of Epirubicin-HCl after i.v. administration of different formulations along with pharmacokinetic parameters obtained using Kinetica; (B) TTC test for determination of infarct size representing heart section of rats treated with different formulations; (C) effect of Epirubicin-HCl targeted and non-targeted liposomal preparations and drug solution on myocardial infarction compared with saline treated control. (D) Relative rise in CK-MB levels due to treatment with different formulations; (E) relative rise in LDH levels due to treatment with different formulations (***indicates statistically significant difference with p < 0.0001, ns = non-significant).