Figures & data
Table 1. The abbreviations of liposomes used in the article.
Table 2. The compositions of liposomes without drugs.
Table 3. The size, PDI, zeta-potential and encapsulating efficiency of different liposomes.
Figure 1. The transmission electron microscope (TEM) photograph of the liposome of Tf/TAT-PTX/DOX-LP.
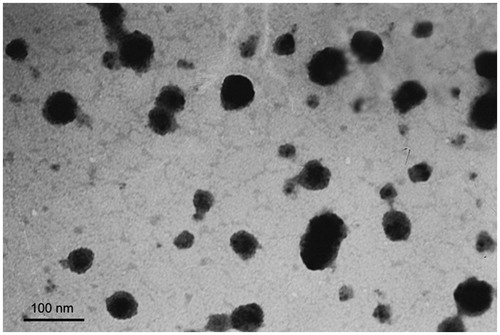
Figure 2. The variations in particle sizes (A) and turbidity (represented by transmittance) (B) of liposomes in 50% FBS. The PTX (C) and DOX (D) release profiles of liposomes in PBS over 48 h at 37 °C. The results are represented as means ± SD (n = 3).
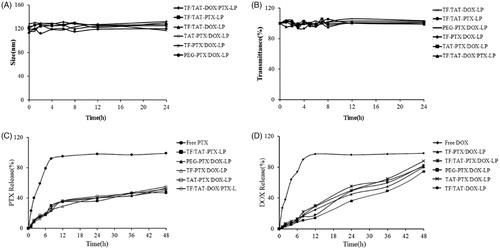
Figure 3. Cellular uptake of DOX-loaded liposomes on B16 cells. (A) Four kinds of liposomes loaded DOX showed red autofluorescence and their uptake by the B16 cells recorded by confocal microscopy. Cell nuclei were stained blue with DAPI. (B) The cellular uptake was further investigated quantitatively by flow cytometry. The results are represented as means ± SD (n = 3). **p < 0.01; ***p < 0.001 versus Tf/TAT-DOX-LP.
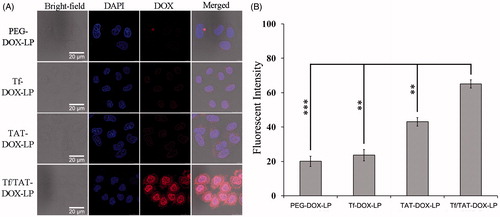
Figure 4. The endocytosis inhibition on Tf/TAT-DOX-LP assay on B16 cells. The results are represented as means ± SD (n = 3). *p < 0.5; **p < 0.01; ***p < 0.001 versus Tf/TAT-DOX-LP.
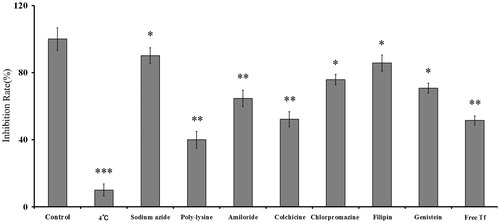
Figure 5. The co-localization of liposomes and lysosomes on B16 cells under CLSM. The Tf/TAT-DOX-LP group showed that the liposomes escaped from the lysosomes to great extent, while the other two group showed that the liposomes were highly trapped inside.
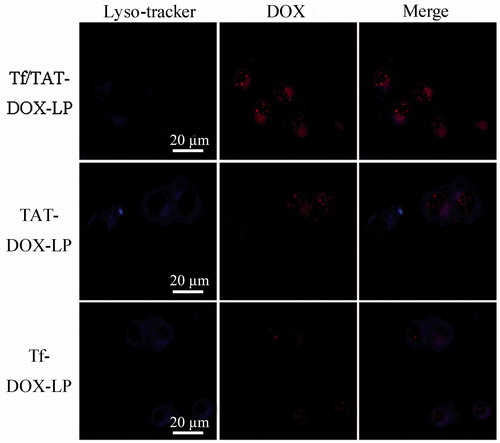
Figure 6. (A) The confocal slicing of DOX-loaded liposomes on B16 tumor spheroid for 4 h using CLSM. The Tf/TAT-DOX-LP group showed the strongest fluorescence among all the groups, demonstrating that this group had the strongest penetrating capability. (B) The quantitative uptake of tumor spheroids 4 h after treatment with DOX-loaded liposomes. Data represent the mean ± SD (n = 3). *p < 0.5; **p < 0.01; ***p < 0.001 versus Tf/TAT-DOX-LP.
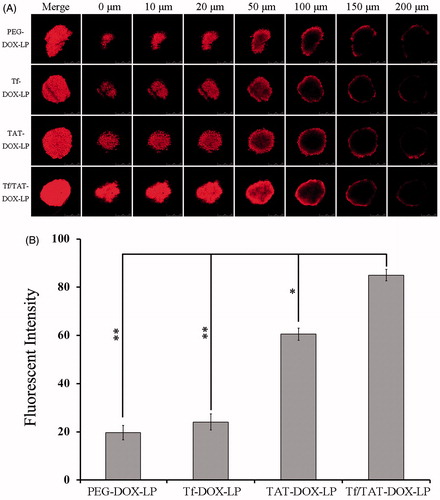
Figure 7. The growth inhibition of different liposomes on B16 tumor spheroid for 7 days. The results are represented as means ± SD (n = 5). ***p < 0.001 versus Blank.
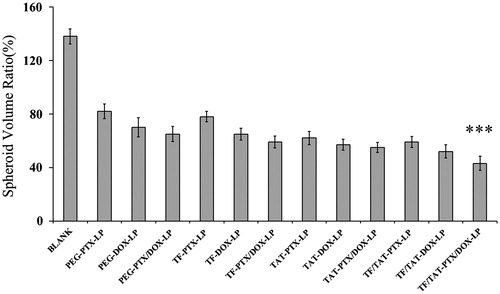
Table 4. IC50 values of representative drugs against B16 cells.
Figure 8. The apoptosis study on B16 cells after incubation with different liposomes. Data represent the mean ± SD (n = 3). The left bar graph showed the percentage of living (survival) cells, while the right bar graph showed the apoptotic and necrotic rate of B16 cells.
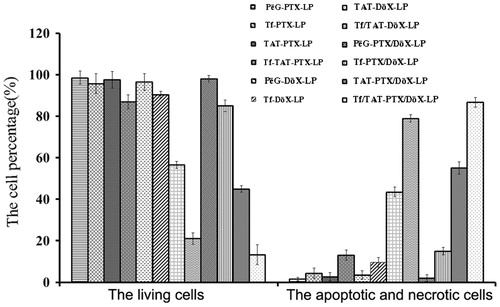
Table 5. IC50 values of representative drugs against bEnd.3 cells.
Figure 9. Cell viability assay of bEnd.3 cells after 48 h incubating with high concentration blank liposomes. No significant differences were shown.
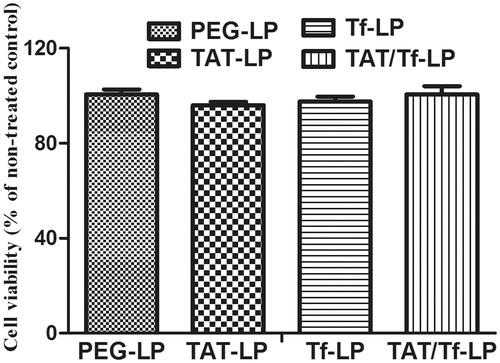
Figure 10. In vivo and ex vivo images of the tumors of B16 bearing mice given different DIR loaded liposomes. (A = Blank, B = PEG-DIR-LP, C = TAT-DIR-LP, D = Tf-DIR-LP, E = Tf/TAT-DIR-LP).
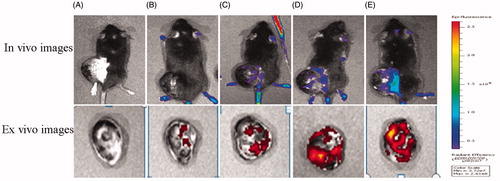
Figure 11. CLSM images of tumor sections from B16 bearing mice 24 h after systemic administration of DIR-loaded liposomes. The Tf/TAT-DIR-LP showed the most obvious fluorescence of DIR among these group in tumor section, while other groups only little fluorescence.
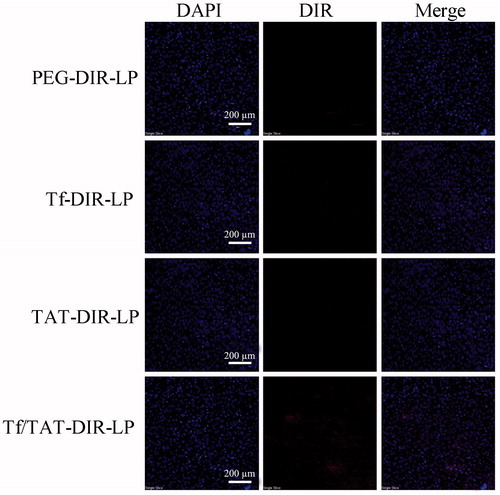
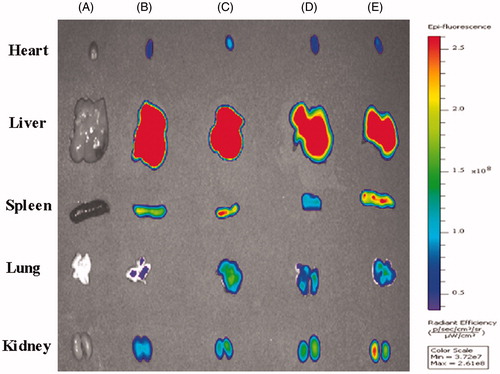
Figure 12. The image of isolated organ of B16 bearing mice 24 h after systemic administration of DIR-loaded liposomes.