Figures & data
Table 1. Composition of conventional curcumin mucoadhesive gels.
Figure 1. Modified balance for determination of detachment force.
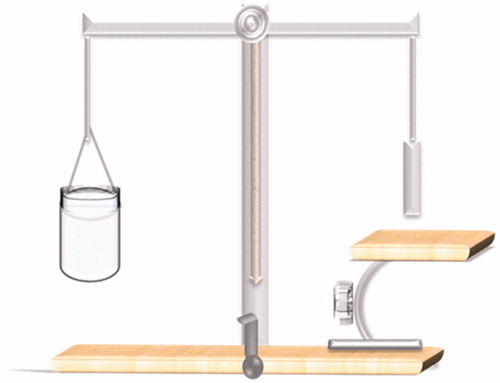
Table 2. Characterization of patients integrated in clinical investigation.
Table 3. Physical characterization of formulated curcumin mucoadhesive gels: viscosity, mucoadhesion, spreadability and in vivo residence time.
Figure 2. (A) In vitro release profiles (dialysis method) of CurSLN-gel in comparison to conventional curcumin mucoadhesive gel P2PX40710 and CurSLN dispersion [dissolution medium: 10 ml ethanol:Water (1:1)] at 37 °C. (B) In vitro release profiles (cup method) of CurSLN-gel in comparison to conventional curcumin mucoadhesive gel P2PX40710 (dissolution medium: 20 ml phosphate buffer, pH 6.8, 0.5% SLS) at 37 °C.
![Figure 2. (A) In vitro release profiles (dialysis method) of CurSLN-gel in comparison to conventional curcumin mucoadhesive gel P2PX40710 and CurSLN dispersion [dissolution medium: 10 ml ethanol:Water (1:1)] at 37 °C. (B) In vitro release profiles (cup method) of CurSLN-gel in comparison to conventional curcumin mucoadhesive gel P2PX40710 (dissolution medium: 20 ml phosphate buffer, pH 6.8, 0.5% SLS) at 37 °C.](/cms/asset/e6950f39-f13a-4b12-a00c-477bc7daa3ef/idrd_a_1065524_f0002_c.jpg)
Table 4. Release models of formulated curcumin mucoadhesive gels.
Figure 3. Amount of curcumin detected in dissected chicken buccal mucosa after 3 h of permeation test at 37 °C.
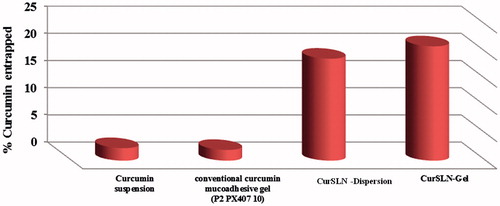
Figure 4. Chicken buccal mucosal tissue stained with osmic acid: (A) after CurSLN-gel was applied for 3 hours and (B) control.
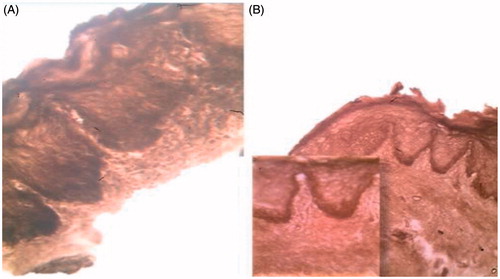
Figure 5. Effective pain index %, after 3, 7 and 10 days of follow-up.
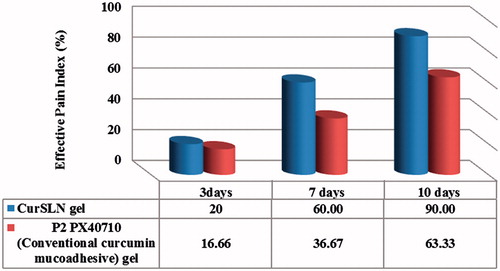
Figure 6. % Reduction of lesion size after 2, 4 and 6 weeks of treatment study period.
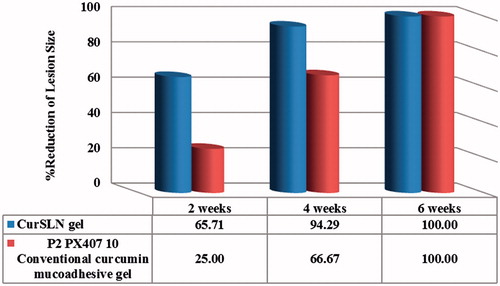
Figure 7. Severe epithelial dysplasia before the treatment showing acanthotic epithelium with drop shape rete pege’s process (H&E ×200).
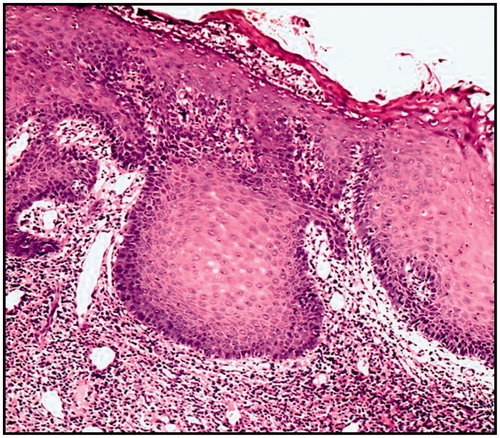
Figure 8. (A) Large cell showing abnormal mitotic figures, (B) basilar hyperplasia in basal cell layer, (C) liquification in basal cell layer and basement membrane with multiple mitotic figure and (D) apoptotic cell (civatte body) with clearance of cytoplasm and characteristic chromatin condensation (H&E ×400).
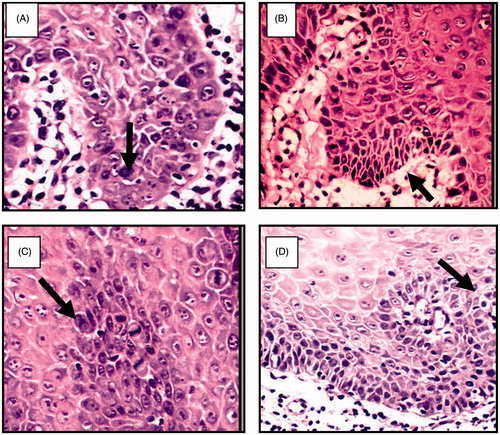
Figure 9. Showing disappearance of epithelial dysplasia after 6 weeks of curcumin treatment.
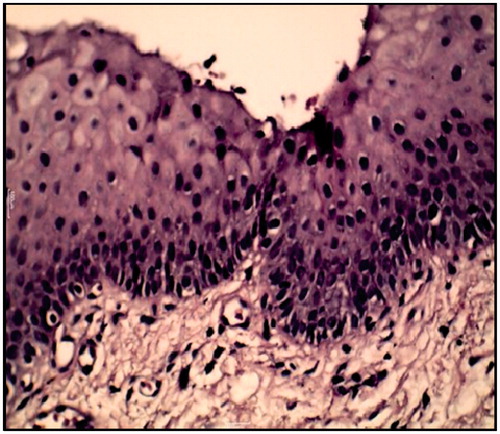
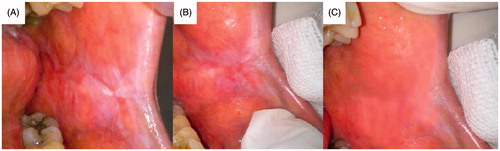
Figure 10. Patient suffering oral erythoplakia (A) before treatment, (B) after 3 weeks and (C) after 6 weeks (treated with CurSLN-gel).
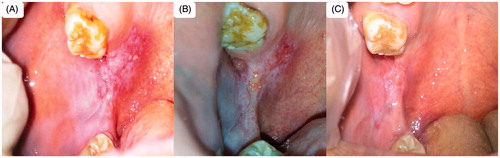
Figure 11. Patient suffering oral erythoplakia: (A) before treatment, (B) after 3 weeks, (C) after 5 weeks and (D) after 6 weeks (treated with CurSLN-gel).
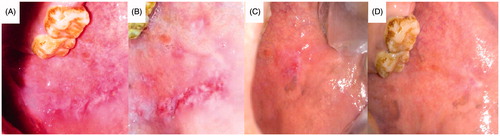
Figure 12. Patient suffering oral erythoplakia: (A) before treatment, (B) after 3 weeks and (C) after 6 weeks (treated with CurSLN-gel).