Figures & data
Table 1. Mice immunization using core or coreE1E2 constructs in different formulations.
Figure 1. Physicochemical properties of the MPG/DNAs complexes: (A) Representative gel retardation assay of MPG peptide complexed with pcDNA-core and pcDNA-coreE1E2 at different N/P ratios; Lane 1: naked plasmid DNA as a control (pcDNA-core), Lane 2: N/P = 1:1, Lane 3: N/P = 2:1, Lane 4: N/P = 5:1, Lane 5: N/P = 10:1, Lane 6: N/P = 15:1 for pcDNA-core, Lane 7: naked plasmid DNA as a control (pcDNA-coreE1E2), Lane 8: N/P = 1:1, Lane 9: N/P = 2:1, Lane 10: N/P = 5:1, Lane 11: N/P = 10:1, Lane 12: N/P = 15:1 for pcDNA-coreE1E2. The DNA complexed with MPG that was not able to migrate into the gels was observed at an N/P ratio of 10:1; (B) The AFM micrograph of the spherical nanoparticles formed at N/P = 10:1 for pcDNA-core and pcDNA-coreE1E2: the nanoparticle was shown in circle; (C) Stability analysis of MPG-based core or coreE1E2 nanoparticles against DNase I. Lane 1: naked plasmid DNA with DNase, Lane 2: N/P = 10:1; (D) Stability analysis of MPG-based core or coreE1E2 nanoparticles against serum: Lane 1: naked plasmid DNAs as a control, Lane 2: N/P = 10:1.
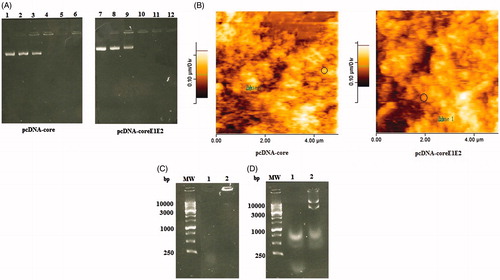
Figure 2. Western blot analysis using an anti-His monoclonal antibody showed the expression of the full-length core (Lane 1 and 2, ∼21 kDa), and coreE1E2 (Lane 1 and 2, ∼83 kDa) proteins using TurboFect and MPG, respectively. Any detectable band was not observed in untransfected cells as a negative control (Lane 3).
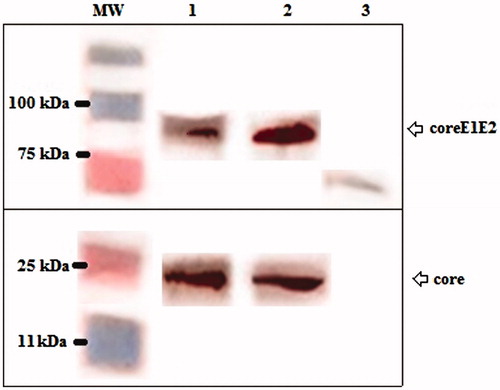
Figure 3. Analysis of IgG2a (A) and IgG1 (B) antibody levels with respect to the coated antigens (the recombinant core and coreE1E2 proteins) using ELISA at 3 weeks after third immunization. Data show antibody responses of pooled mice sera with independent experiments, and error bars indicate mean ± SD; (*p < 0.05).
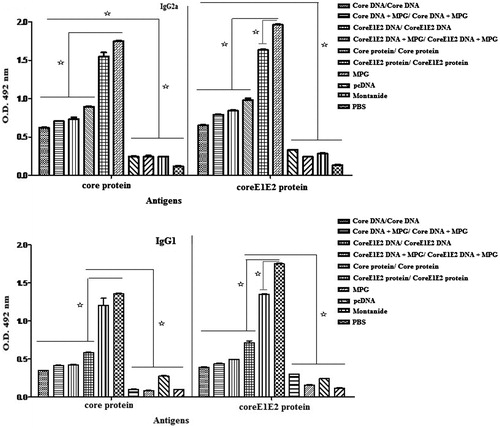
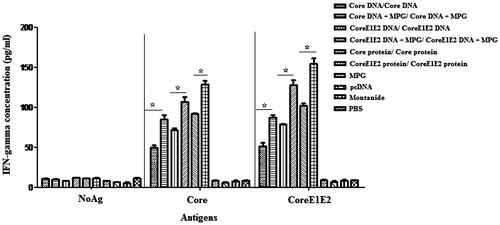
Figure 4. Analysis of IFN-γ secretion in mice immunized by core and coreE1E2 in different formulations at 3 weeks after booster: all assays were performed in triplicate. Error bars indicate mean ± SD detected in pg/ml. Mice immunization with protein-based immunizations and then the DNAs formulated by MPG-induced high HCV-specific cellular immune responses; (*p < 0.05).