Figures & data
Table 1. Physicochemical property of liposomal formulations.
Figure 1. Particle size distribution of liposomes (A: PTX-TSL; B: NTSL), which were determined using PCS (Nanophox, Sympatec GmbH, Germany). Liposome suspension was diluted with distilled water, laser intensity was adjusted to 50–60%, desired temperature was 25 °C, measuring mode was cross correlation.
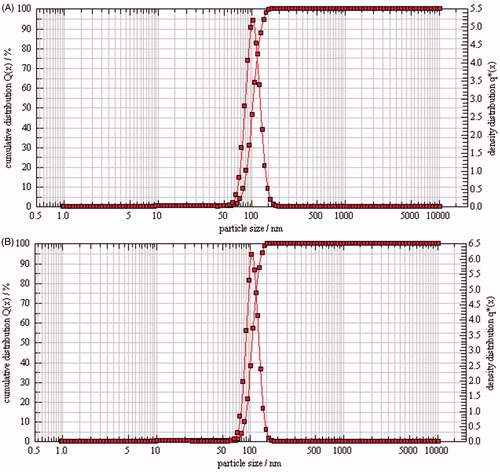
Figure 2. Transmission electron microscope photos of PTX-TSL (A) and NTSL (B), which show the morphology of the liposome dropped on a copper grid and stained with 2% phosphotungstic acid, then observed by TEM (JEM-1010, JEOL Ltd., Tokyo, Japan).
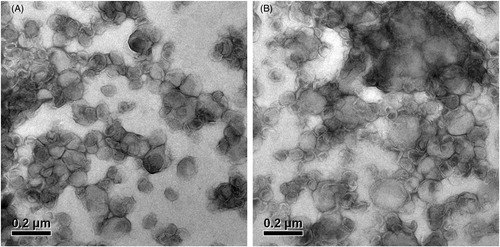
Figure 3. DSC of liposomal formulations, which shows phase transition of the TSL and NTSL, determined by differential scanning calorimetry (Q2000 differential scanning calorimeter, TA Instruments, USA).
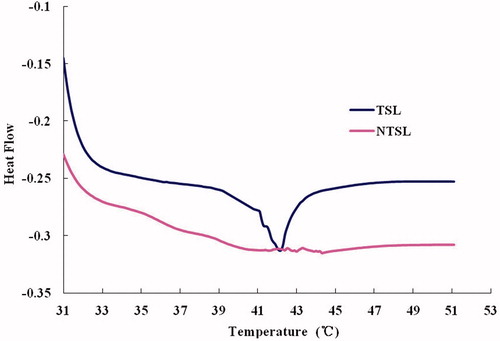
Figure 4. In vitro, drug release from PTX-TSL and NTSL in vitro, determined at 37 °C and 42 °C, respectively. An aliquot of liposomal dispersion (0.4 mL) was dispersed into 10 mL release medium, i.e. PBS (pH 7.4) containing 0.5 M sodium salicylate. Then the suspension was placed into a dialysis tube immersed in release medium, samples were taken at predetermined time. Content of PTX released was determined by HPLC.
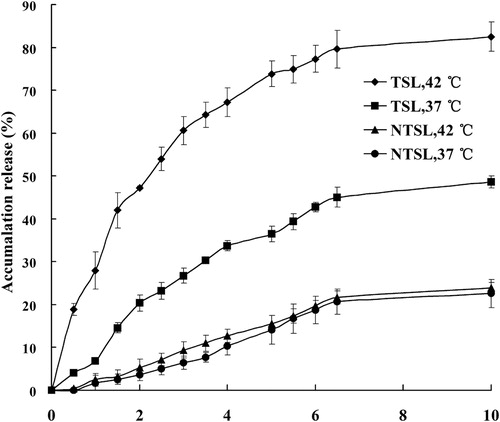
Figure 5. Transmission and backscattering profiles of liposomes by using Turbiscan Lab® Expert, an implement able to reflect the negligible variation of colloidal solution by determination of transmission and backscattering. At appointed time points, 10 mL PTX-TSL placed into tailor-made sample cell was exposed to Turbiscan Lab® Expert and measured.
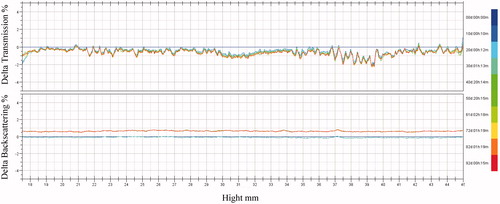
Table 2. Stability data of PTX-TSL, at −20 °C.
Figure 6. In vivo, tumor accumulation of paclitaxil in tumor bearing mice, which were randomly divided into 6 treatment groups: PI (PTX injection), NTSL, and PTX-TSL with or without hyperthermia. All groups received intravenous injection of 10 mg/kg PTX (PI or NTSL, PTX-TSL).
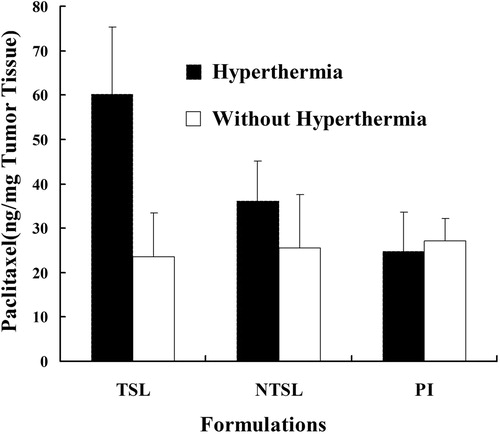
Figure 7. Antitumor efficiency of various paclitaxil formulations on tumor-bearing mice (n = 9), which were randomly divided into four treatment groups: control group (5% glucose), PI, NTSL, PTX-TSL group. The groups were given three sequential injections every 72 h at a dose of 10 mg/kg of PTX, the mice were exposed to local hyperthermia above for 30 min.
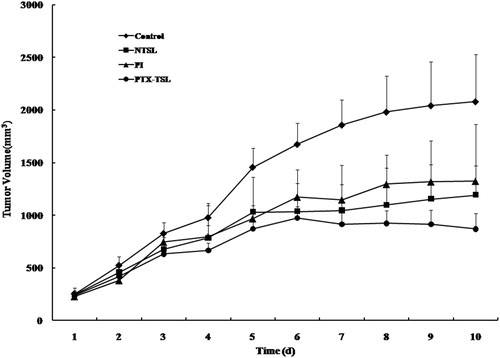
Table 3. Volume, mass, and inhibition rate of tumor (n = 10).
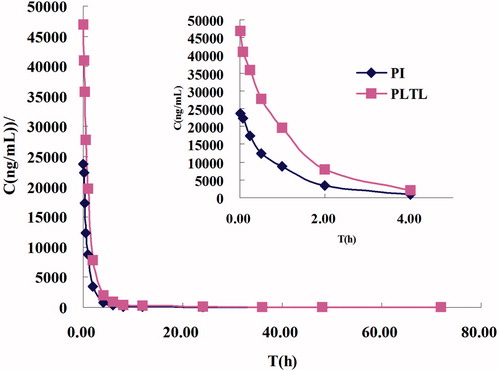
Figure 8. Concentration/time profiles of PTX formulations (PTX-TSL, NTSL, and PI). Each formulation was injected at a dose of 7.0 mg/kg, based on the total paclitaxel levels in plasma measured by HPLC-MS/MS.