Figures & data
Figure 1. The photograph (A), particle size distribution (B), and cry-TEM image (C) of the DPLs.
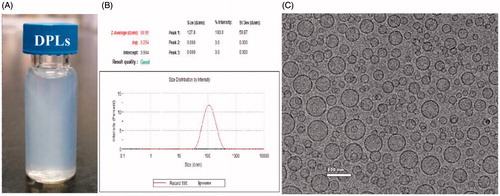
Figure 2. The diluted stability (A), long-term stability (B), and plasma stability (C) of DPLs.
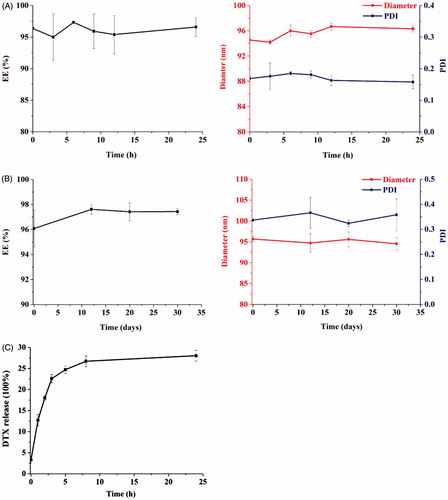
Figure 3. In vitro release profiles of DTX from DPLs in PBS (pH 7.4), PBS (pH 7.4) with 0.002 mM GSH, 0.01 mM GSH, 0.1 mM GSH, 1 mM GSH, and 10 mM GSH.
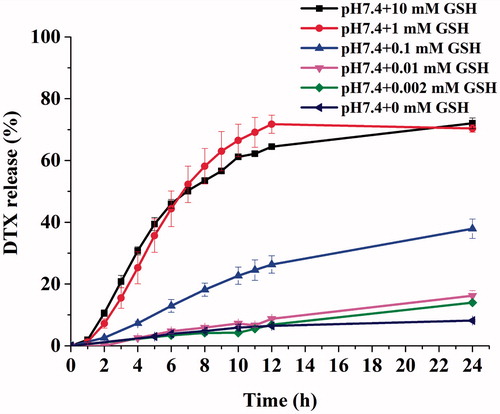
Figure 4. In vitro cytotoxicity of different concentrations of DTX-Sol and DPLs after incubation with A549 cells (A) and PC-3 (B) for 48 h, 72 h, and 96 h.
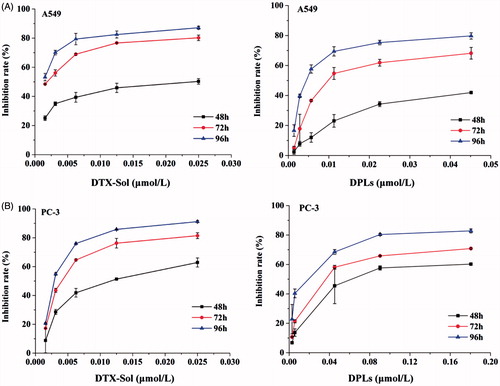
Figure 5. Flow cytometry plots of A549 cells and PC-3 cells treated with DTX-Sol and DPLs for 24 h, stained with Annexin V/PI, assessed by flow cytometry.
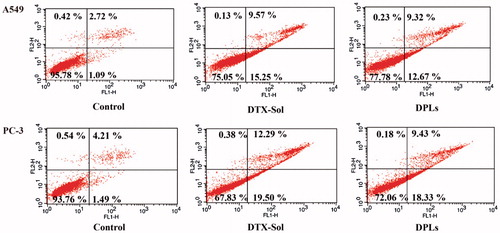
Figure 6. (A) Plasma concentration-time curves of DTX following intravenous administration of DTX-Sol and DPLs at a dose of 12 mg DTX/kg to rats (mean ± SD, n = 5). (B) Biodistribution of DTX in A549 tumor-bearing nude mice at 5 h after intravenous injection of DTX-Sol and DPLs (**p < 0.01 versus DTX-Sol group).
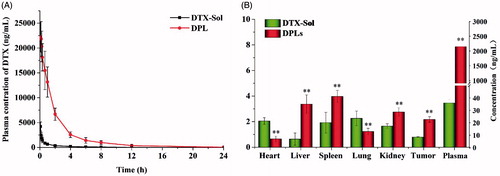
Figure 7. In vivo antitumor efficiency of different treatment groups in A549 tumor-bearing nude mice. (A) the changes of tumor volume; (B) the body weight variations; (C) the tumor weight and the calculated inhibition rate of tumor growth at the end of experiment.
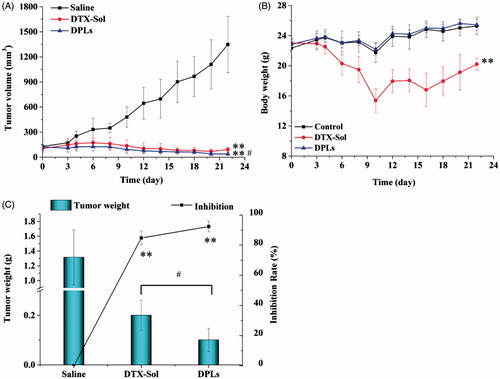
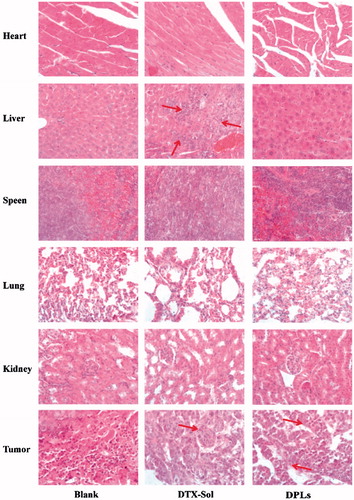
Figure 8. Histological examination of heart, liver, spleen, lungs, kidney, and tumor slices excised from A549 tumor-bearing nude mice on the 22th day after the respective treatment with saline, DTX-Sol and DPLs.