Figures & data
Figure 1. Schematic diagram of GOD reaction; glucose oxidase catalyzes the oxidation of β-D-glucose by molecular oxygen to δ-gluconolactone.
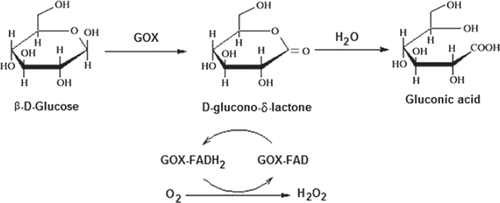
Figure 2. Scanning electron micrographs of PPy/PVS electrode surface: (a) without enzyme; (b) with enzyme.
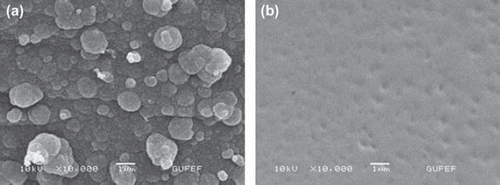
Figure 3. Effect of the amount of glutaraldehyde on the amperometric response of glucose biosensor (0.1 M, pH 7.5 phosphate buffer, 25°C).
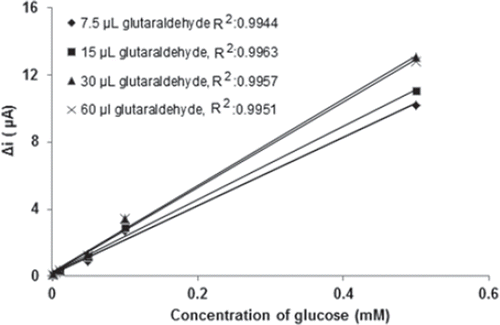
Table I. Effect of the amount of glutaraldehyde on the reproducibility of glucose biosensor.
Figure 4. Effect of the working potential on the biosensor response (0.1 M, pH 7.5 phosphate buffer, 25°C).
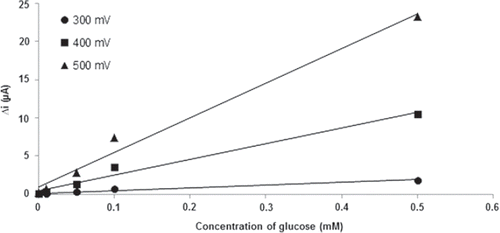
Figure 5. Effect of the pH on the biosensor response (phosphate buffer, 25°C).
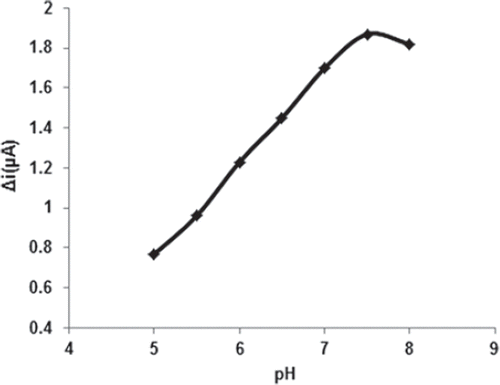
Figure 6. Effect of the temperature on the biosensor response (0.1 M, pH 7.5 phosphate buffer).
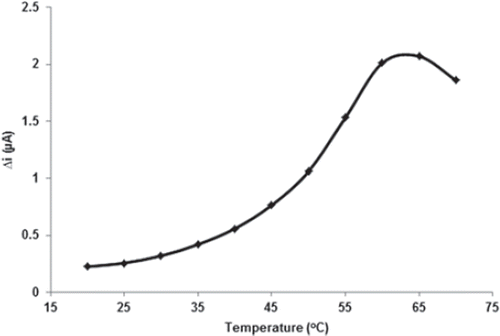
Figure 7. The effect of glucose concentration upon the amperometric response of the biosensor (Michealis-Menten plot, in pH 7.5 phosphate buffer; operating potential is +0.4 V, 25°C).
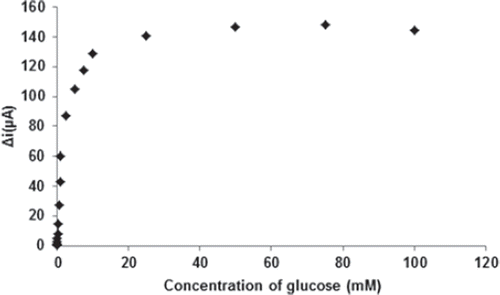
Figure 8. The calibration curves of the glucose biosensor ranging between (a) 1.0× 10⁻⁶-5×10⁻⁵M; (b) 5×10⁻⁵M-1mM (0.1 M, pH 7.5 phosphate buffer, 25°C).
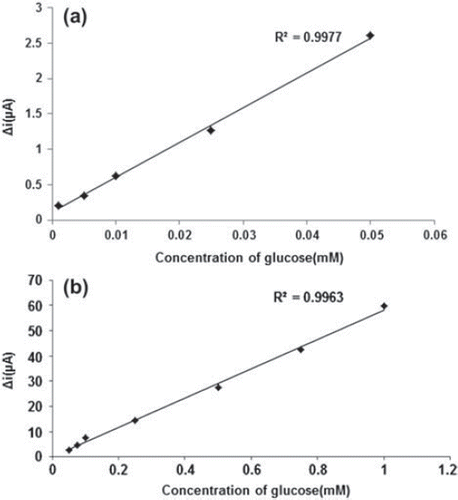
Figure 9. The effect of glucose concentration upon the amperometric response of the biosensor (Lineweaver-Burk plot, in pH 7.5 phosphate buffer and at a 0.4 V operating potential, 25°C).
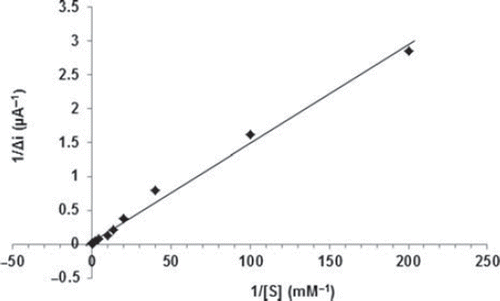
Figure 10. Reuse number of the enzyme electrode (5.0 10-5M glucose concentration, 0.1 M pH 7.5 phosphate buffer, 25°C).
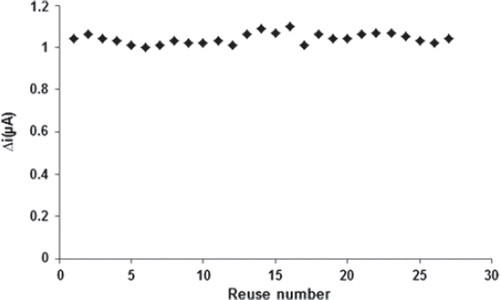
Figure 11. Storage stabilization of the enzyme electrode (0.1 M, pH 7.5 phosphate buffer, 25°C).
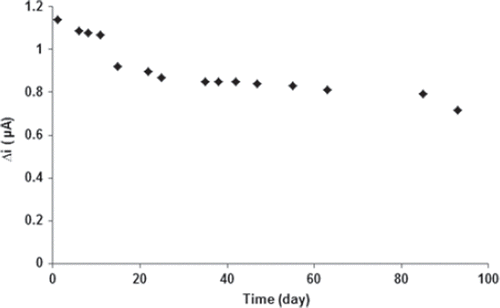
Table II. Effect of potential interferants on the glucose biosensor.
Table III. Determination of glucose in blood serum samples.