Figures & data
Figure 1. Diagrammatic representation of symptoms of swine flu (H1N1).
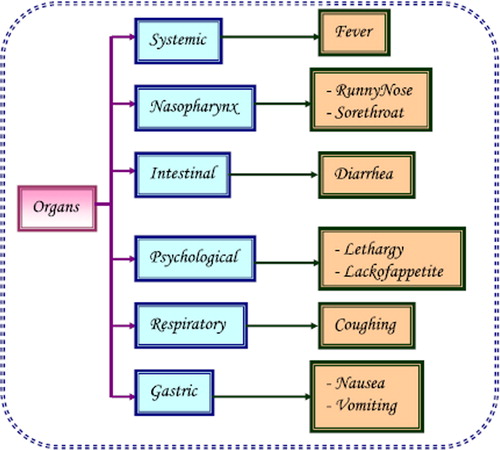
Figure 2 A. Worldwide status of swine flu outbreaks. B. Percent occurrence of swine flu in population of various countries.
Figure 3. Antigenic drift of influenza A virus analyzed using monoclonal antibodies.

Table I. Summary of the different methods for detection of Influenza A (H1N1).
Figure 4. Diagrammatic illustration of immunofluorescent antibody testing.