Figures & data
Figure 1. Preoperative planning of varus–valgus angle (left) on AP radiograph and anteversion angle (right) on ML ratiograph.
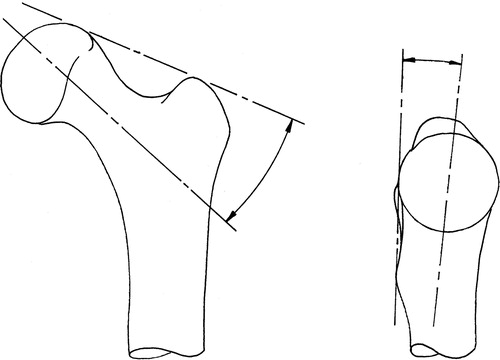
Figure 2. Registration tool position on femur.
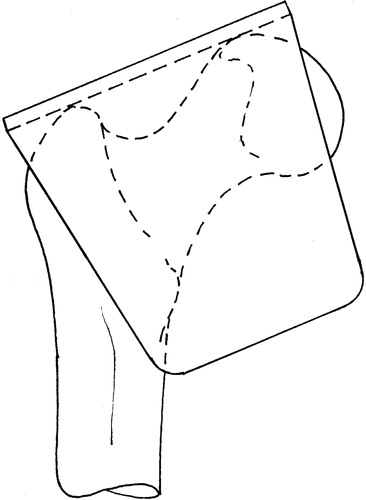
Figure 3. Caliper tool position for AP line (left) and PD lines (right).
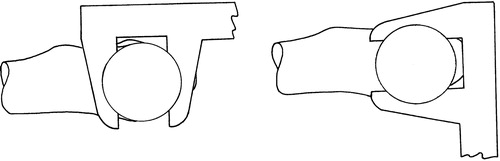
Figure 4. Femoral head as draped for the experiment. A rigid body with an optical reference frame is attached to the femur.
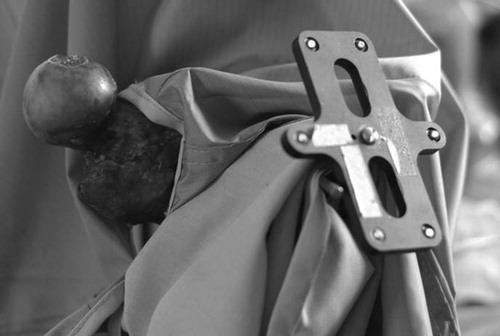
Figure 5. Post-operative X-rays used to assess pin placement relative to initial surgical goals.
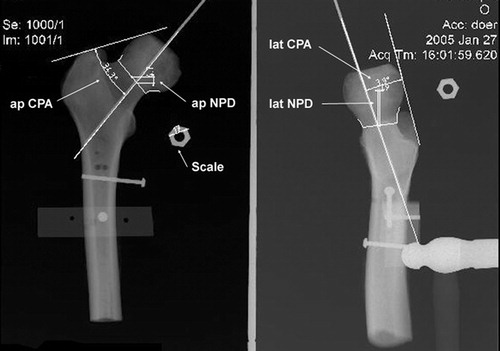
Figure 6. Results of the experiment. Top left: varus/valgus and retro/anteversion position of the driven pin on post-operative X-ray relative to the planned line (• = Durom, ○ = CAS), along with the difference between the targeted pin axes before driving (▵ = Durom–CAS). Top right: difference between the positions of the targeted pin axes at the level of the femoral neck centre (▵ = Durom–CAS). Bottom left: variability in the final pin angle relative to the targeted pin angle due to the driving process. Bottom right: time required to aim the guide before driving the pin. The thick bars represent the standard deviation of the sample, and the thin bars represent the maximum or minimum values.
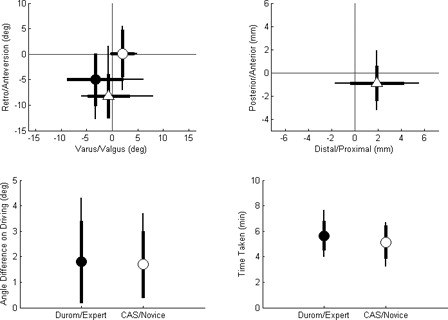
Table I. Completion times for targeting procedure for CAS and Durom techniques.