Figures & data
Table 1. Size of each organisation and number of years since active support first implemented at time of Year 4 data collection.
Table 2. Number of services included and number of people consenting to participate in each organisation at each time point, plus average observed staff: client ratio at each time point for each organisation.
Table 3. Participant mean age (with range) for the sample in each year and each organisation.
Table 4. Participant characteristics: score on aberrant behaviour checklist (mean and range) and gender distribution in each year and by organisation.
Table 5. Participant characteristics – physical disability and communication difficulties.
Table 6. Mean engagement (with range) in meaningful activities over time and by organisation with mean level of adaptive behaviour (and range).
Figure 1. For overall sample, percentage of time (mean and range) spent in engagement overall, in social and non-social activity and in self-stimulatory or other repetitive or inappropriate behaviour (does not include aggression, destruction or self-injurious behaviour which were rarely observed).
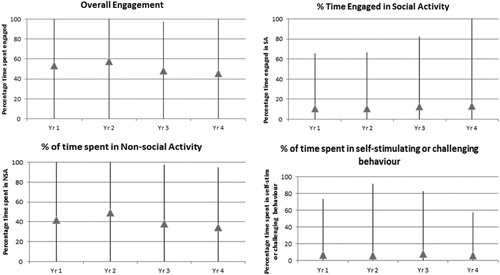
Table 7. Percentage of time spent engaged compared to benchmarked figures for appropriate ABS grouping presented in Mansell and Beadle-Brown (Citation2012, Chapter 3 Table 3.9).
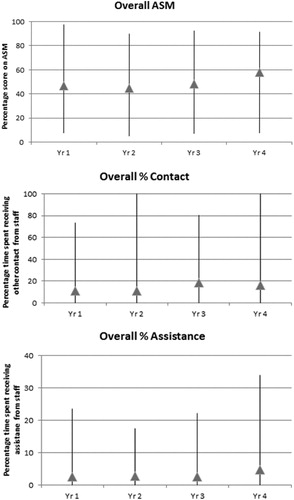
Figure 2. Average (and range) scores on the ASM and the percentage of time (mean and range) receiving any contact, and assistance.