Figures & data
Figure 1. The chemical structure of ligustrazine.
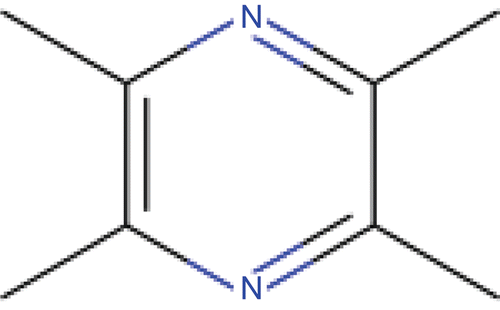
Table 1. Blood parameters.
Figure 2. (A) Representative hematoxylin and eosin (H&E) staining for the thoracic aortas (400× magnification). (B) Quantification of lesion area. (C) mRNA quantification for the antioxidant genes in aorta. Data are expressed as mean ± SEM (for each group, n = 10). ##P < 0.01 compared with control (CTL) rats; *P < 0.05 and **P < 0.01 compared with atherosclerotic (As) rats.
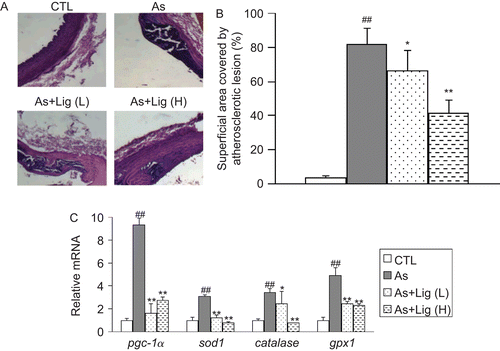
Figure 3. (A) Representative hematoxylin and eosin (H&E) staining for the livers (400× magnification). (B) Lipid profile in the livers. (C) mRNA quantification for the antioxidant genes. (D) mRNA quantification for the genes in fatty acid oxidation. Data are expressed as mean ± SEM (for each group, n = 10). #P < 0.05 and ##P < 0.01 compared with control (CTL) rats; *P < 0.05 and **P < 0.01 compared with atherosclerotic (As) rats.
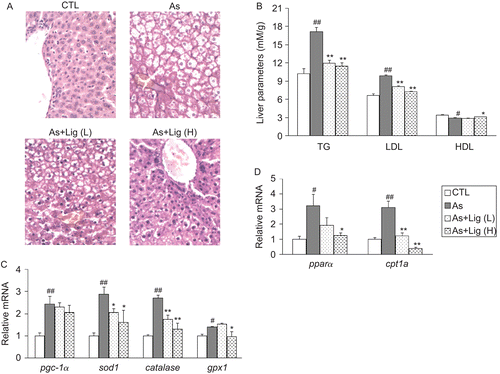
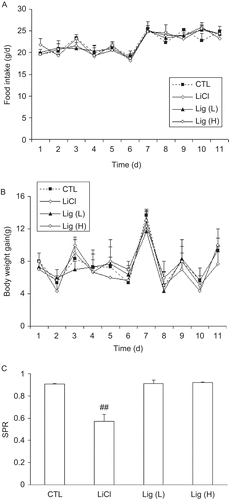
Figure 4. Daily food intake (A) and body weight gain (B) of normal rats given saline solution or Lig. (C) Effect of Lig treatment on saccharin preference of rats. Data are expressed as mean ± SEM (for each group, n = 6). ##P < 0.01 compared with control (CTL) rats.