Figures & data
Figure 1. The photos of 10 dry adult sea cucumbers. (A) Acaudina leucopraocta H. L. Clark; (B) Thelenota ananas (Jaeger); (C) Stichopus chloronotus Brandt; (D) Pearsonothuria graeffei Semper; (E) Holothuria pardalis Selenka; (F) Holothuria verrucosa Selenka; (G) Holothuia leucospilota (Brandt); (H) Holothuia fuscogliva Cherbonnier; (I) Holothuia nobilis (Selenka); (J) Holothura hilla Lesson.
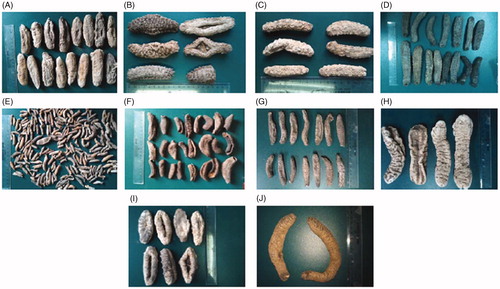
Table 1. Sequences of the primers used in real-time PCR (mice).
Table 2. Sequences of the primers used in real-time PCR (HepG2 cells).
Figure 2. Effects of the extracts of sea cucumbers on pancreatic lipase activity in vitro. The activities were compared with that of the vehicle control. Orlistat was used as a positive control with concentration of 1 μM. Concentrations for all extracts were 2.5 μg/mL. Values are mean ± SEM for five reactions in each group. *p < 0.01 versus control.
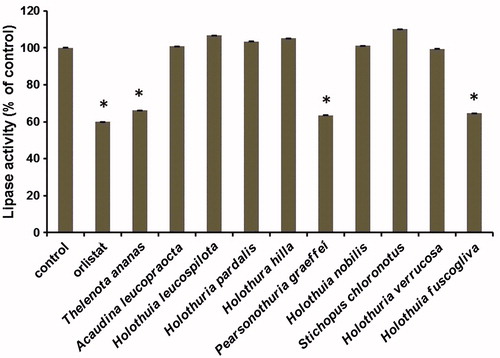
Figure 3. LC-MS analysis of the most abundant constituent SC-3. A peak of 27.73 is echinoside A (M = 1206), a peak of 19.80 is holothurin A (M = 1220), a peak of 18.68 is holothurin A1 (M = 1222), a peak of 25.19 is 24-dehydroechinoside A (M = 1204).
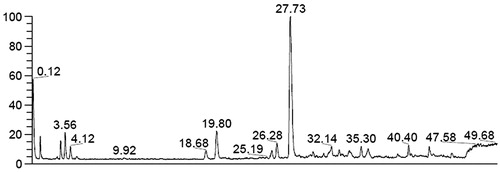
Figure 4. SC-3 affected body weight and white adipocyte in C57BL/six mice. Body weight gain (A) and food intake in preventive experiment (B). Body weight gain (C) and food intake in therapeutic experiment (D). The scanning electron microscope images of abdominal white adipocyte mouse from chow diets (E), HF (F), and 0.2% SC-3 (G) group. (H) The quantitation of adipocyte size. Values are mean ± SEM for seven mice in each group; # and ## for the low-dose group (0.1% SC-3) versus the HF-fed group (HF); * and ** for the high-dose group (0.2% SC-3) versus the HF-fed group (HF), * and # p < 0.05; ** and ## p < 0.01.
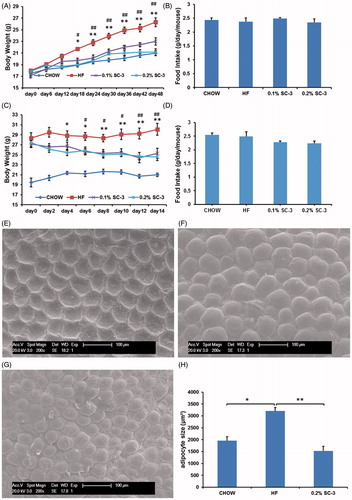
Figure 5. SC-3 improved glucose tolerance, serum lipids and liver lipids. Fasting blood glucose levels (0 min) and glucose tolerance test (GTT), the mice were measured blood glucose after fasted 10 h as blood glucose levels of 0 min. Then, intraperitoneal inject glucose (1 g/kg) and blood glucose levels were tested at regular intervals of 15, 30, 60, and 90 min. (A) GTT test in preventive experiment; (B) GTT test in therapeutic experiment. (C) SC-3 reduced TC, TG, LDL-c, and HDL-c in serum in preventive experiment, heart blood was taken after fasting 10 h. (D) SC-3 reduced TC, TG, and LDL-c in serum in therapeutic experiment, heart blood was taken after fasting 10 h. The TC (E) and TG (F) in liver of the low-dose group and the high-dose group are less than the group of HF. Values are mean ± SEM for seven mice in each group; # and ## for the low-dose group (0.1% SC-3) versus the HF-fed group (HF); * and ** for the high-dose group (0.2% SC-3) versus the HF-fed group (HF), * and #p < 0.05; ** and ##p < 0.01.
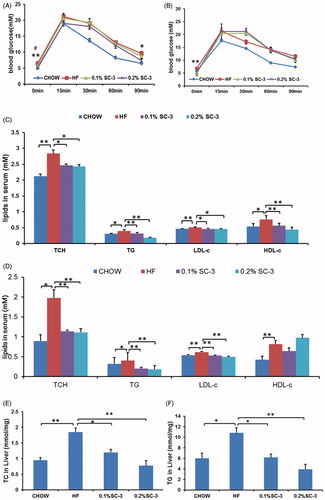
Figure 6. SC-3 inhibits the activity of porcine pancreatic lipase. The contents of fecal TC (A) and TG (B). (C) Pancreatic lipase activity. The pancreatic lipase activity in vitro was determined using 4-nitrophenyl butyrate as substrate (4-NPB, 0.06 mM). The activity was compared with that of vehicle control. (D) Kinetic analysis. Three plots were analysis of vehicle control, 0.5 μg/mL and 0.5 μg/mL using 4-nitrophenyl butyrate (4-NPB, 0–0.1 mM). For (A) and (B), values were mean ± SEM for seven mice in each group. *p < 0.05; **p < 0.01. For (C) and (D), values were mean ± SEM for five reactions in each group.
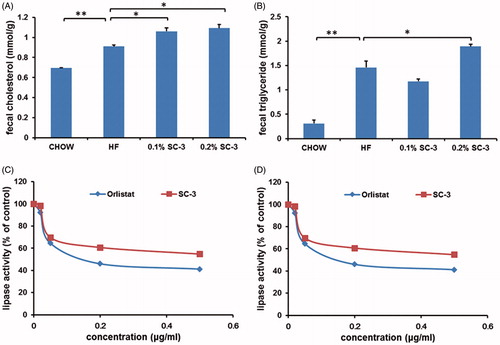
Figure 7. Echinoside A inhibits the activity of porcine pancreatic lipase. (A) Structure of echinoside A. (B) Pancreatic lipase activity. The pancreatic lipase activity in vitro was determined using 4-nitrophenyl butyrate as substrate (4-NPB, 0.06 mM). The activity was compared with that of vehicle control. (C) Kinetic analysis. Three plots were analysis of vehicle control, 1 μM and 10 μM using 4-nitrophenyl butyrate (4-NPB, 0–0.1 mM). For (B) and (C), values were mean ± SEM for five reactions in each group.
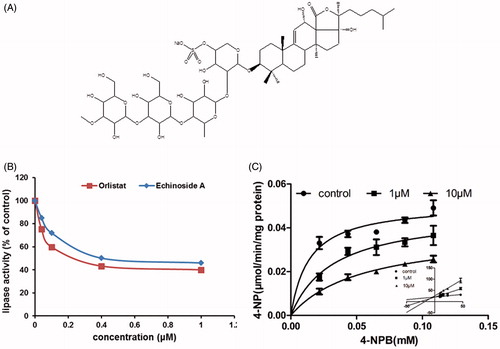
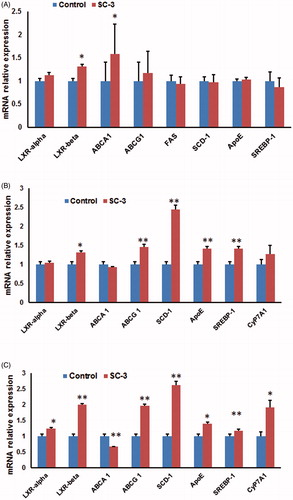
Figure 8. Effects of samples on the relative mRNA expression levels on the liver of obese mouse and HepG2 cells. (A) The gene expression level in liver of SC-3-treated mouse was compared with that of HF control mouse. Values are presented as means ± SEM for six mice in each group. (B) The gene expression level of SC-3-treated HepG2 cells was compared with that of control. Values are presented as means ± SEM for four wells in each group. (C) The gene expression level of echinoside A-treated HepG2 cells was compared with that of control. Values are presented as means ± SEM for four wells in each group. β-Actin was used as an internal control. *p < 0.05, **p < 0.01.