Figures & data
Figure 1. Effect of CGA on d-gal-induced changes in hepatic (A) and renal (B and C) functional markers. All data are represented as mean ± SD (n = 6). *p <0.05 as compared with the control group; #p <0.05 as compared with the d-gal group.
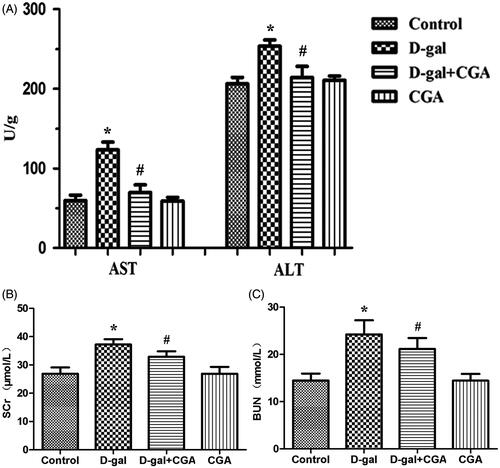
Figure 2. Effect of CGA on histopathological changes of the d-gal-treated mouse liver (A) and kidney (B), (n = 4). Arrow indicated to the structure damage, degeneration, and necrosis of hepatocytes and nephrocytes. Original magnification, 10 × 40.
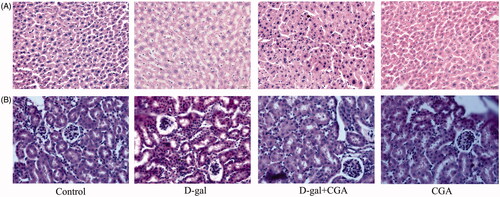
Figure 3. Effects of CGA on the levels of malondialdehyde (MDA) (A and B) and glutathione (GSH) (C and D) and the activities of superoxide dismutase (SOD) (E and F) and catalase (CAT) (G and H) in the liver and kidney of mice. All values are expressed as mean ± SD (n = 6).
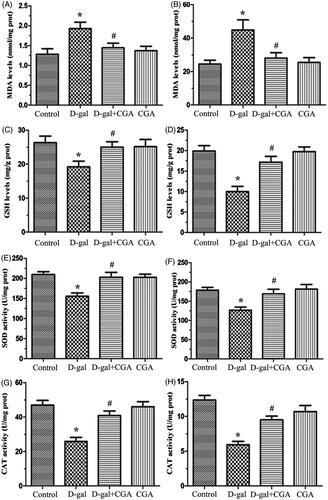
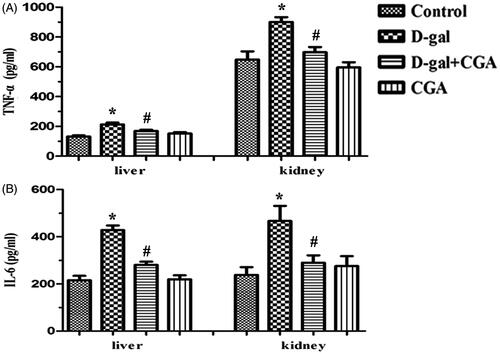
Figure 4. Effect of CGA on tumor necrosis factor-α (TNF-α) and interleukin-6 (IL-6) levels in the liver (A) and kidney (B) of d-gal-induced mice. Values are expressed as mean ± SD (n = 6).