1,134
Views
49
CrossRef citations to date
0
Altmetric
Original Article

Interactions of melatonin and serotonin with lactoperoxidase enzyme

, , &
Pages 779-783 | Received 11 Jun 2009, Accepted 15 Oct 2009, Published online: 02 Feb 2010

Figures & data

Table 1. Purification scheme of lactoperoxidase obtained after the application of different purification steps.

Figure 1. Sodium dodecyl sulfate-polyacrylamide gel electrophoresis (SDS-PAGE) bands of lactoperoxidase (LPO) purified from bovine milk. Column a: standard proteins, 1: maltose-binding protein (MBP)–β-galactosidase (fusion of MBP and β-galactosidase, 175 kDa); 2: MBP–paramyosin (fusion of MBP and paramyosin, 80 kDa); 3: MBP–chitin binding domain (CBD) (fusion of MBP and CBD, 58 kDa); 4: CBD–Mxe Intein–2CBD (fusion of CBD and Mxe Intein followed by two CBDs, 46 kDa). Column b: purified LPO from bovine milk.
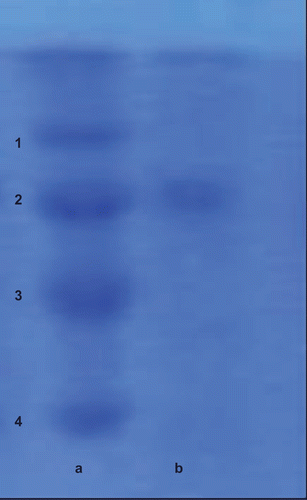
Figure 1.  Sodium dodecyl sulfate-polyacrylamide gel electrophoresis (SDS-PAGE) bands of lactoperoxidase (LPO) purified from bovine milk. Column a: standard proteins, 1: maltose-binding protein (MBP)–β-galactosidase (fusion of MBP and β-galactosidase, 175 kDa); 2: MBP–paramyosin (fusion of MBP and paramyosin, 80 kDa); 3: MBP–chitin binding domain (CBD) (fusion of MBP and CBD, 58 kDa); 4: CBD–Mxe Intein–2CBD (fusion of CBD and Mxe Intein followed by two CBDs, 46 kDa). Column b: purified LPO from bovine milk.

Figure 2. The effect of different concentrations of melatonin (0.5–2.5 mM) on lactoperoxidase obtained from bovine milk.
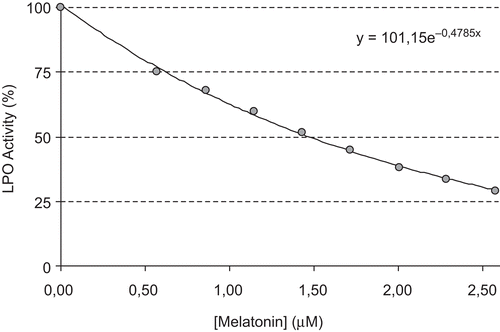
Figure 2.  The effect of different concentrations of melatonin (0.5–2.5 mM) on lactoperoxidase obtained from bovine milk.

Figure 3. Lineweaver–Burk plot for different ABTS concentrations and three different melatonin concentrations for determination of Ki constant.
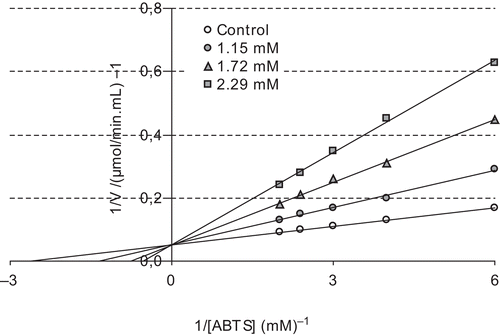
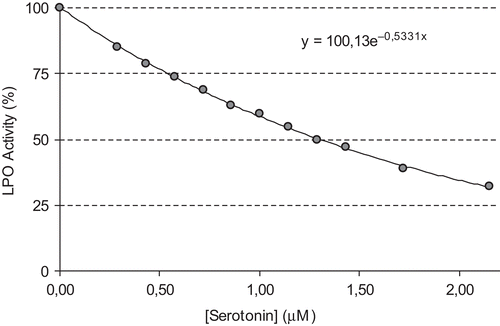
Figure 3.  Lineweaver–Burk plot for different ABTS concentrations and three different melatonin concentrations for determination of Ki constant.
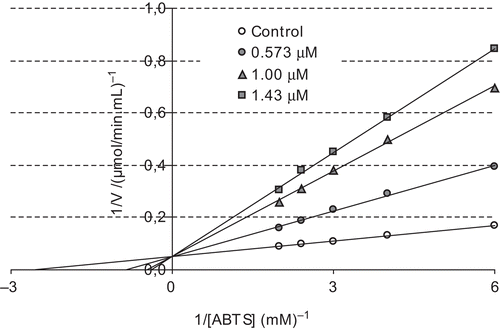
Figure 4. The effect of serotonin at different concentrations (0.5–2.15 mM) on bovine milk lactoperoxidase.

Figure 4.  The effect of serotonin at different concentrations (0.5–2.15 mM) on bovine milk lactoperoxidase.

Figure 5. Lineweaver–Burk plot for different ABTS concentrations and three different serotonin concentrations for determination of Ki constant.

Figure 5.  Lineweaver–Burk plot for different ABTS concentrations and three different serotonin concentrations for determination of Ki constant.

Reprints and Corporate Permissions

Please note: Selecting permissions does not provide access to the full text of the article, please see our help page How do I view content?

To request a reprint or corporate permissions for this article, please click on the relevant link below:

Academic Permissions

Please note: Selecting permissions does not provide access to the full text of the article, please see our help page How do I view content?

Obtain permissions instantly via Rightslink by clicking on the button below:

If you are unable to obtain permissions via Rightslink, please complete and submit this Permissions form. For more information, please visit our Permissions help page.